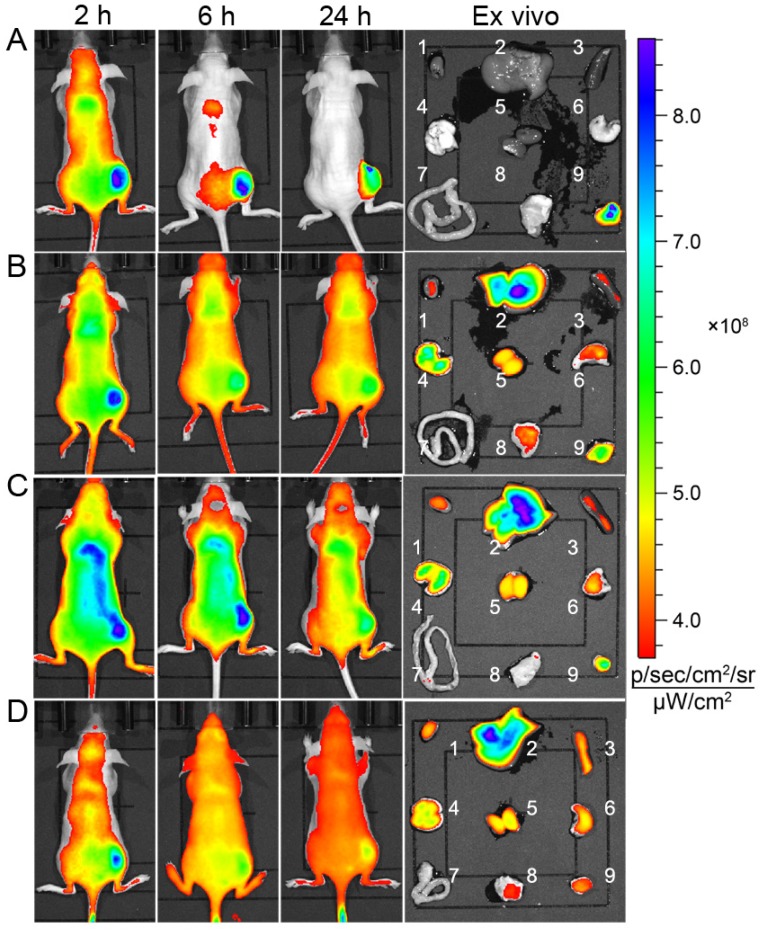
Figure 5.
Time-dependent in vivo and ex vivo fluorescence images (1: heart; 2: liver; 3: spleen; 4: lung; 5: kidney; 6: stomach; 7: intestines; 8: muscle; 9: tumor) of subcutaneous HeLa tumor-bearing mice after i.v. injection of (A) DGLipo NPs, (B) DGLipo NPs (without RGD), (C) Dox/MPP-DGL or (D) Dox/Duplex. The order of red, orange, yellow, green, and blue corresponds to the successive increase in fluorescence intensity. The fluorescence images were acquired using IVIS Spectrum instrument equipped with 675/30 nm excitation and 720/20 nm emission filters. The color bar indicates the fluorescence radiant efficiency, multiplied by 108.

