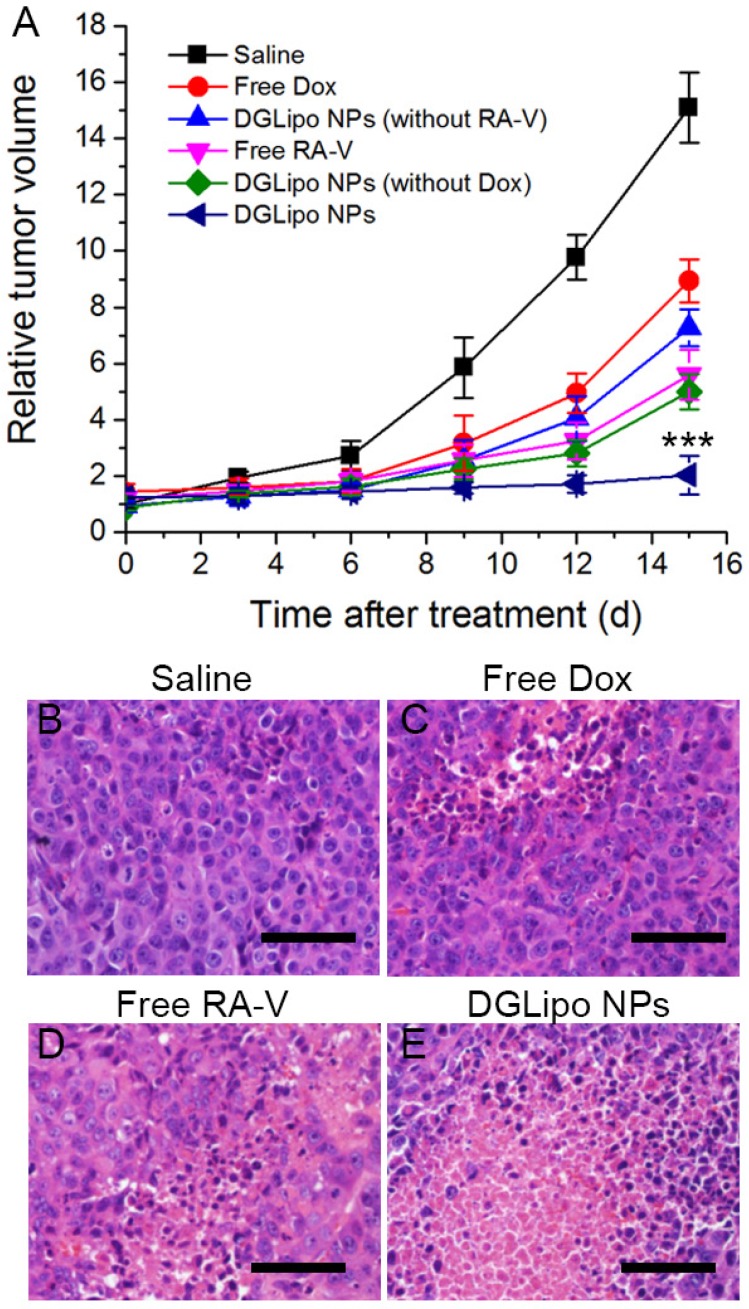
Figure 6.
(A) Change of relative tumor volume (V/V0) upon different treatments. Data are means ± SD (n = 6), ***P < 0.001 compared to other groups using a one-way ANOVA. Tumors at 24 h post-treatment and corresponding H&E staining of tumor slides: (B) saline injection; (C) free Dox injection; (D) free RA-V injection; (E) DGLipo NPs injection. Scale bars: 100 μm.

