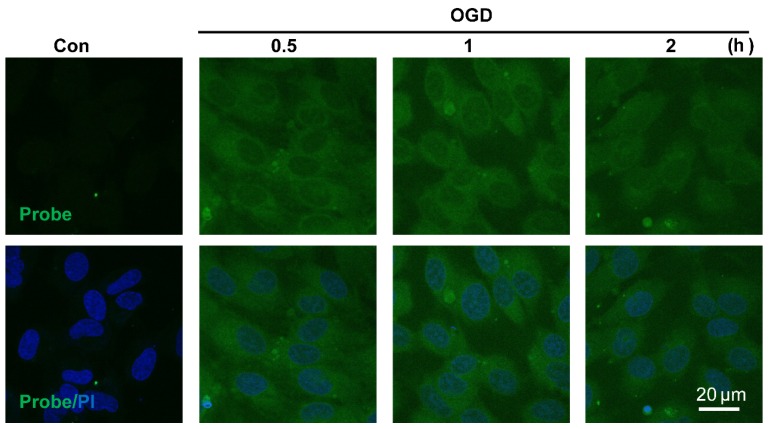
Figure 4.
Visualizing endogenous H2O2 formation using AP in endothelial cells following oxygen-glucose deprivation (OGD). The representative confocal images showed temporal changes of AP fluorescence (green, 460 nm) in EA.hy926 endothelial cells over 0.5 to 2 h following OGD. PI counterstaining indicated nuclear localization (blue, 620 nm). Overlay image of AP fluorescence and PI are shown. Scale bar represents 20 μm.

