
Fig. 3.
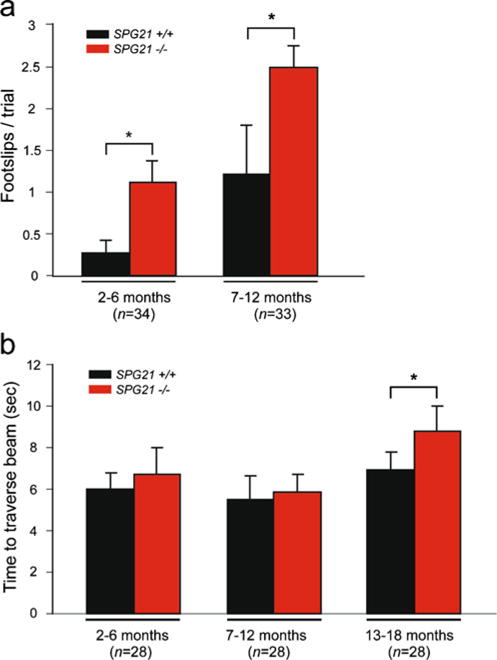
Narrow beam-walking analysis of SPG21−/− mice. a, b Mice of the indicated ages were subjected to the beam-walking test, and foot slips (a) and time to traverse (b) were recorded. Means ± S.D. are shown graphically; *p<0.05
Official websites use .gov
A
.gov website belongs to an official
government organization in the United States.
Secure .gov websites use HTTPS
A lock (
) or https:// means you've safely
connected to the .gov website. Share sensitive
information only on official, secure websites.
Narrow beam-walking analysis of SPG21−/− mice. a, b Mice of the indicated ages were subjected to the beam-walking test, and foot slips (a) and time to traverse (b) were recorded. Means ± S.D. are shown graphically; *p<0.05