Figure 1.
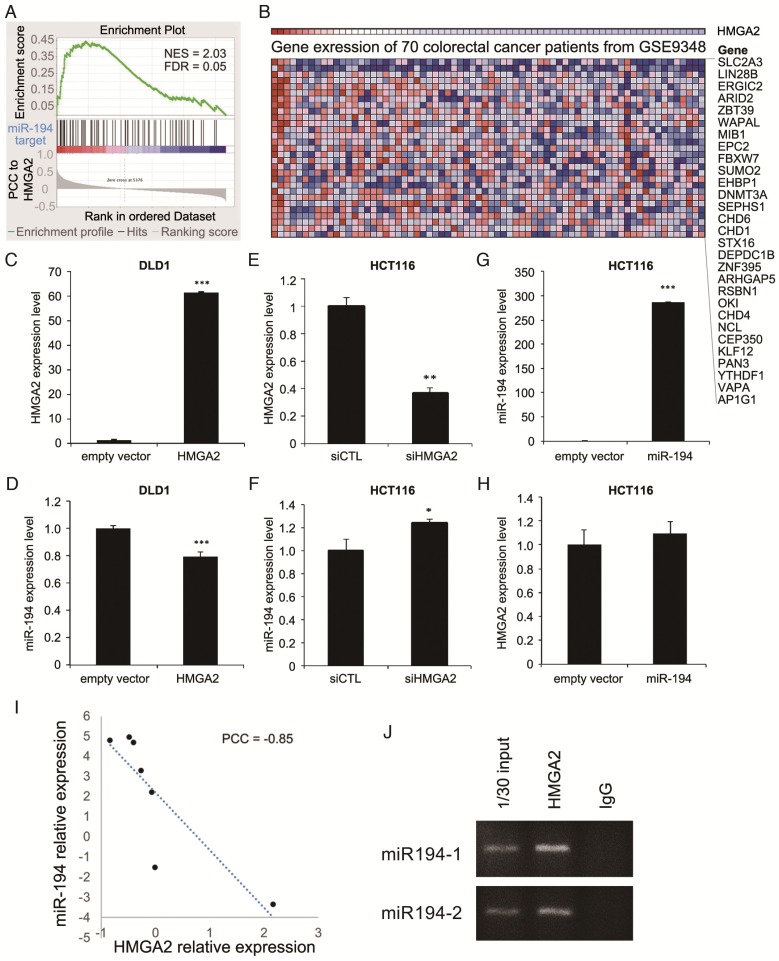
Bioinformatics analysis on gene expression profiles revealed HMGA2 expression is correlated with miR-194 target genes. (A) GSEA of correlation between miR-194 target genes and HMGA2 correlated genes. (B) Heatmap shows the top miR-194-regulated genes with positive enrichment in HMGA2 highly expressed samples. To unveil the relationship between miR-194 and HMGA2, low HMGA2 expressing DLD-1 cells (C and D) were utilized for HMGA2 overexpression, and high HMGA2 expressing HCT116 cells (E to H) were used for HMGA2 knockdown or miR-194 overexpression. The expression levels of HMGA2 and miR-194 were confirmed (C, E, and G), and the corresponding levels of miR-194 and HMGA2 were determined (D, F, and H). *P-value < 0.05; **P-value < 0.01; ***P-value < 0.001. (I) Correlation between HMGA2 and miR-194 expression in CRC cell lines in CellMiner database. (J) Chromatin immunoprecipitation was performed to examine the HMGA2 bound DNA sequences. Primers amplifying sequences of miR-194-1 and miR-194-2 promoters were utilized to inspect whether HMGA2 directly regulates miR-194 expression. Input DNA and immunoprecipitation from IgG isotype were used as positive and negative controls, respectively.

