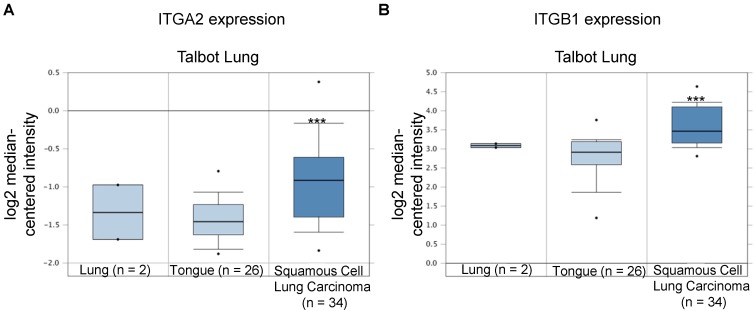
Figure 11.
Integrin β1 (ITGB1) expression was upregulated in NSCLC in clinical cancer samples of the Talbot Lung dataset from the Oncomine online microarray database. The Talbot Lung dataset comprises 62 specimens, including 28 normal lung and tongue specimens and 34 squamous cell carcinoma specimens. A box-and-whisker plot that represents ITGB1 expression from primary tumors compared to normal specimens in ten datasets from the Oncomine database. The horizontal top and bottom lines of each box represents the 75th and the 25th percentile, respectively. The band in the box is the median value. Horizontal lines above and below the box represent the 90th and the 10th percentile, respectively. The dots above the 90th percentile and below the 10th percentile represent the maximum and minimum values, respectively. *** P < 0.001.

