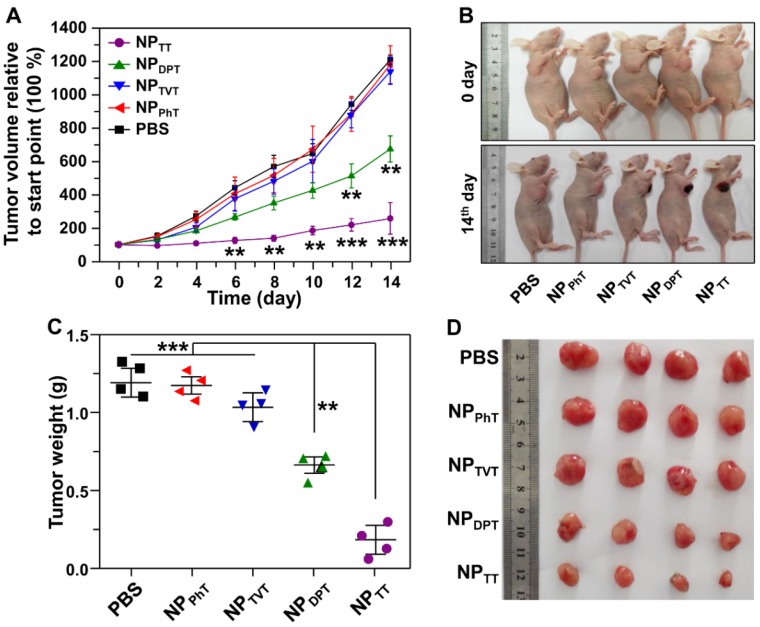
Figure 8.
The PT therapy of these SP@NPs. (A) The MDA-MB-231 tumor growth curves of different groups of mice after intratumoral injection of SP@NPs (40 μg SP per mice) with NIR irradiation (808 nm, 0.5 W/cm2, 10 min). (B) Representative pictures of mice before and on day 14 after PT therapy. (C) The weight of the tumors was assessed after the last determination (n = 4). (D) Photos of the tumors extracted from the mice bearing MDA-MB-231 tumor at the end of the experiment.

