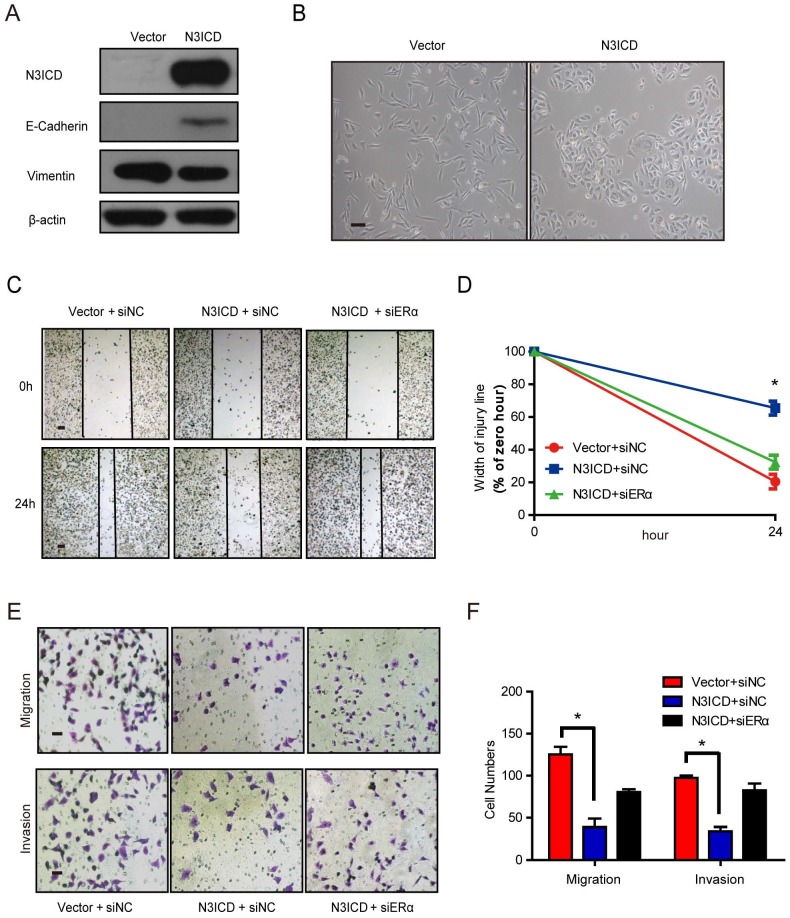
Figure 4.
N3ICD overexpression in MDA-MB-231 cells reverses EMT. (A) Western blot showing the protein levels of E-cadherin and Vimentin after overexpressing N3ICD in MDA-MB-231 cells. (B) Morphology of MDA-MB-231 cells transfected with N3ICD or a control vector, Scale bars represent 50 μm. (C and D) Representative images (C) and quantitative (D) wound recovery data after 24 h in MDA-MB-231 cells transfected with N3ICD and ERα siRNA. Scale bars represent 50 μm. (E and F) Representative micrographs and quantitative data of Matrigel-coated or non-coated transwell assays. Stably transfected N3ICD MDA-MB-231 cells were co-transfected with siERα or siNC. Invading or migrating cells were counted in 5 random fields. Scale bars represent 50 μm. All experiments were performed at least three times and data were statistically analyzed by two-sided t-test. *P < 0.05 versus control. Error bars indicate SEM.

