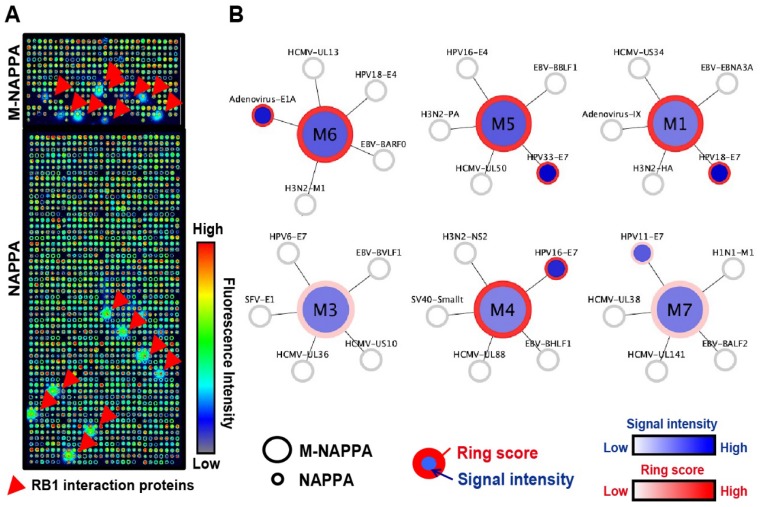
Figure 4.
Detection of protein-protein interactions on M-NAPPA. (A) Representative images of Rb1-HaloTag binding to its known protein targets on M-NAPPA and NAPPA, which were detected using a chicken anti-HaloTag antibody and Alexa555 goat anti-chicken antibody. Rb1's protein partners are indicated with a red arrow. False-colored images across a rainbow scale corresponds to the relative level of Rb1 binding signal, where low and high Rb1 binding levels are represented by blue and red, respectively; (B) Multiplexed features on M-NAPPA (large circle) and the deconvoluted features on NAPPA (smaller connecting circles) that bound to Rb1-HaloTag. The blue scale bar corresponds to the relative level of Rb1 binding signal within the spot while the white-to-red color scale corresponds to the level of Rb1 binding signal to diffused target protein outside of the spot (i.e., “ring”).

