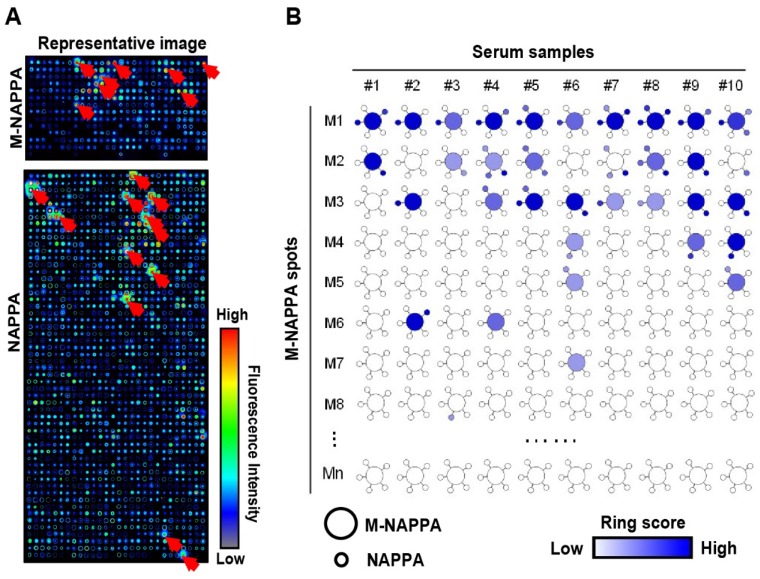
Figure 5.
Detection of serological antibodies on viral M-NAPPA arrays. (A) Representative images of viral antibody detection on M-NAPPA and NAPPA; (B) Comparison of anti-viral antibodies binding to their displayed protein antigens on M-NAPPA (large circle of five multiplexed genes) and NAPPA (small circle of deconvoluted genes). The blue scale bar corresponds to the relative level of antibody binding signal.

