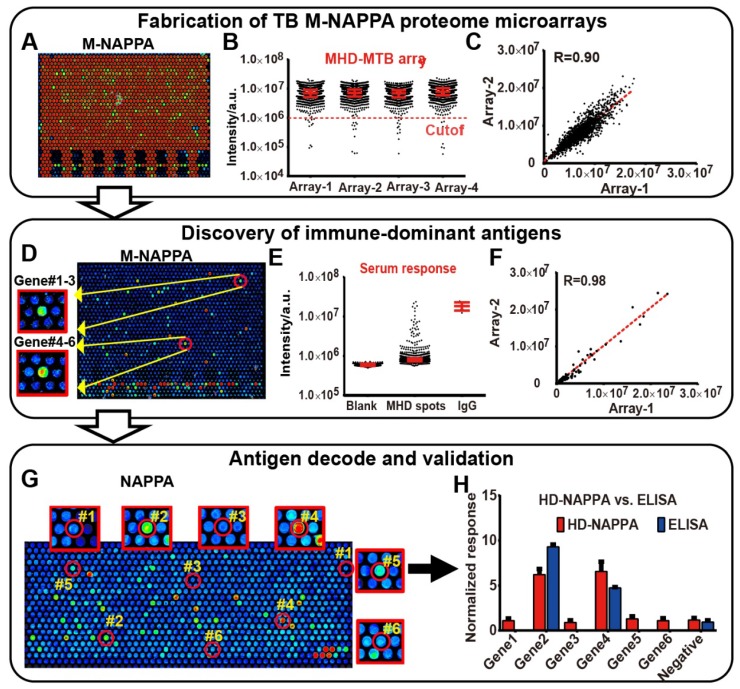
Figure 6.
M-NAPPA TB proteome microarray fabrication, protein display, and role in detecting immune-dominant antigens. (A) Representative image of protein display on M-NAPPA TB proteome microarrays; (B) Distribution of protein display across four M-NAPPA TB proteome microarrays using an antibody specific to the capturing fusion tag; (C) Correlation of protein display across different TB proteome microarrays; (D) Representative image of serological antibody detection on an M-NAPPA TB proteome microarray; (E) Distribution of serum antibody binding signals on a M-NAPPA TB proteome microarray; (F) Correlation of serological antibody detection using M-NAPPA TB proteome microarrays; (G) Deconvoluted and verification of TB antibody candidates from M-NAPPA using NAPPA protein microarrays; (H) Validation of a reactive serological antibody on M-NAPPA and NAPPA using ELISA. (A, D, G) False-colored images across a rainbow scale where low and high binding are represented by blue and red, respectively.

