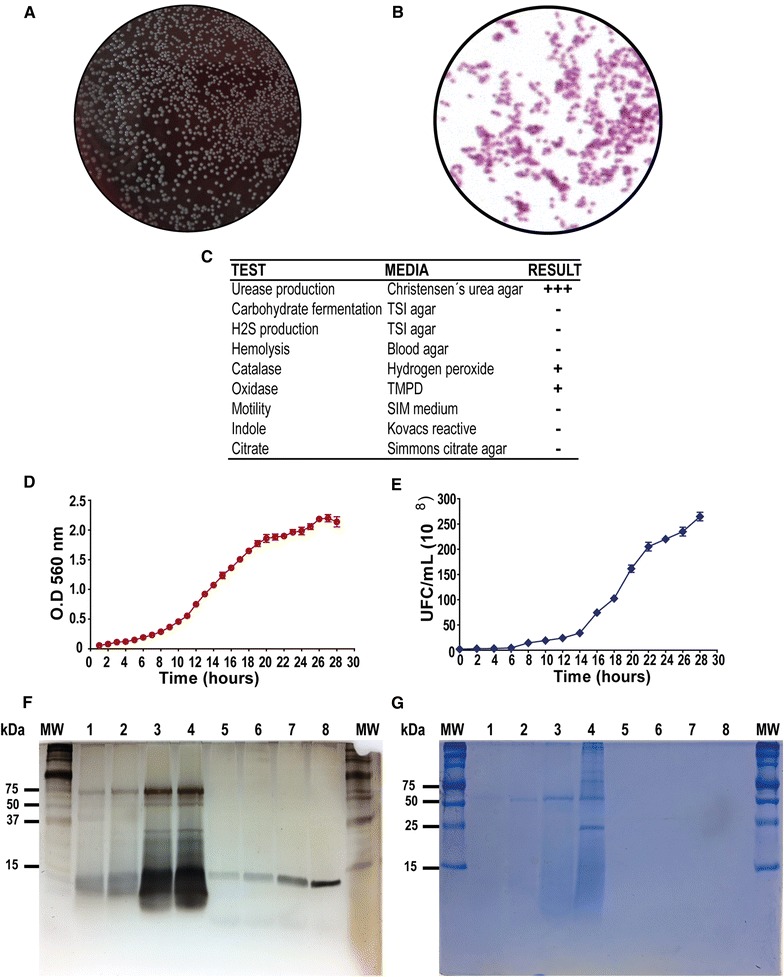
Figure 1.

Brucella canis microbiological characterization, LPS isolation and growth curves. Colonies growing on 5% horse blood agar (A), bacteria observed under optical microscopy (B), and biochemical profile analyzed under different conditions (C). Bacterial growth curves plotted as time versus optical density (OD) (D) and time versus colony-forming units/mL (CFU/mL) (E). Silver stained SDS-PAGE (F) and Comassie blue gels (G) of whole cellular membrane lysate of B. canis (lanes 1–4) and its purified LPS (lanes 5–8).
