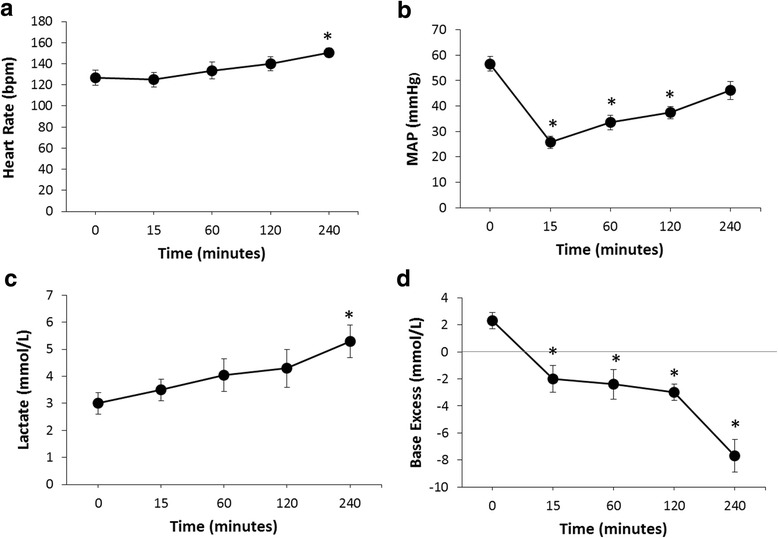
Fig. 2.

(a) Time course of heart rate (HR), (b) mean arterial pressure (MAP), (c) blood lactate level and (d) base excess level measurements at different time points for the first 4 hr following polytraumatic injury and during the early reperfusion/ resuscitation and recovery phase. Each point represents the mean ± SEM of surviving NHPs. * P<0.05 indicates a significant difference from T0 (pre-hemorrhage)
