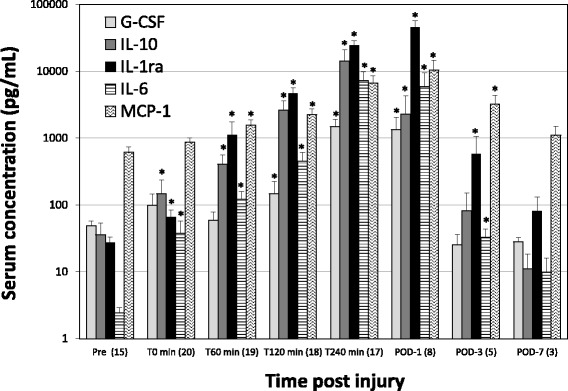
Fig. 4.

Comparison of serum G-CSF, IL-10, IL-1ra, IL-6 and MCP-1 (CCL2) levels at various time points following polytraumatic injury. Results are expressed as the means ± SE of the number of survived NHPs noted in parentheses each below time point. * P<0.05 indicates a significant difference from T0 (pre-hemorrhage)
