. 2015 May 26;6(8):4681–4689. doi: 10.1039/c5sc01124h

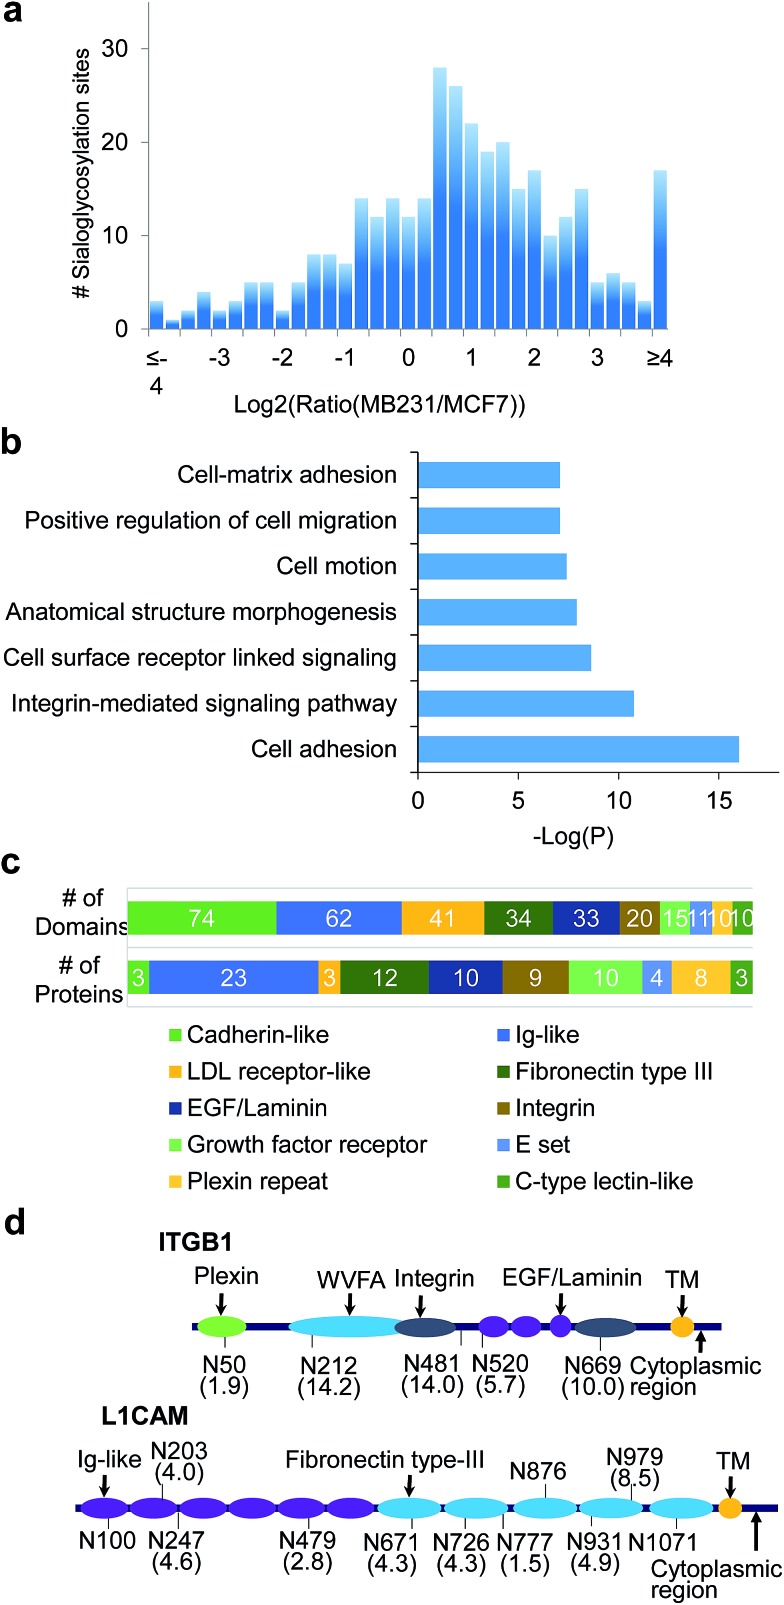
Fig. 6. Site specific quantification of surface N-sialoglycoproteins between invasive MDA-MB-231 and non-invasive MCF-7 breast cancer cells. (a) Abundance distribution of quantified N-sialoglycopeptides between invasive MDA-MB-231 and non-invasive MCF-7 cells. (b) Clustering of glycoproteins containing up-regulated N-sialoglycopeptides based on biological processes. The y-axis is –log(P) where the P value reflects the enrichment of N-sialoglycoprotein groups. (c) The results of the domain analysis for up-regulated N-sialoglycoproteins. The number of top ten domain hits are in the top row and the number of protein containing each domain are in the bottom row. (d) Two examples (ITGB1 and L1CAM) of N-sialoglycoproteins with different domains and quantified sites (MDA-MB-231 vs. MCF-7). The domain names are marked, and the site abundance changes are included in the parentheses below the sites.

Fig. 6