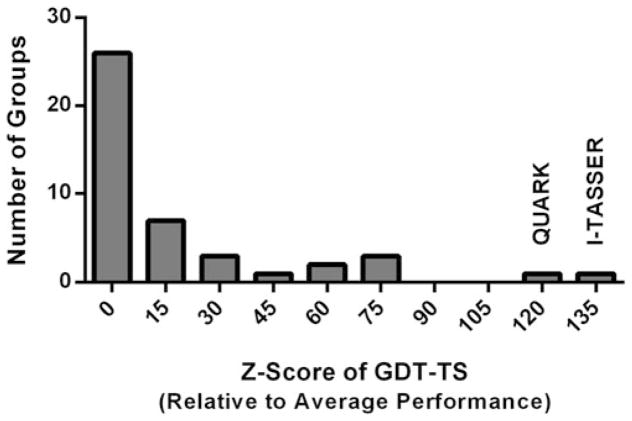
Fig. 3.
Histogram of the Z-scores of all automated protein structure predictors in the CASP11 experiment. The first bin contains groups that have Z-score below 0. Data are taken from official CASP webpage at URL http://www.predictioncenter.org/casp11/zscores_final.cgi?model_type=first&gr_type=server_only

