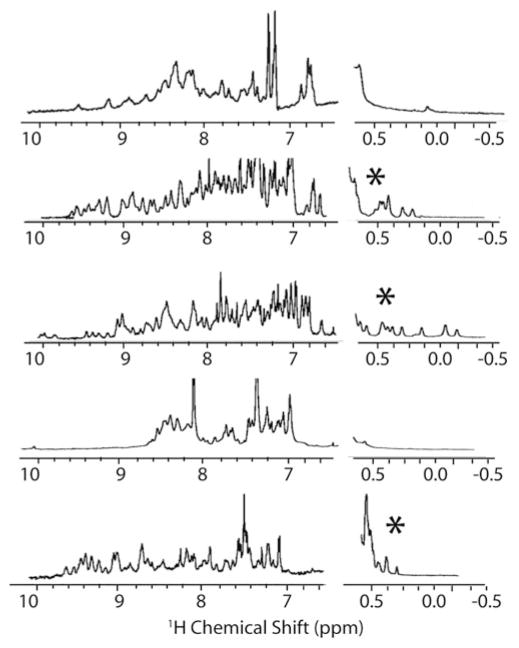
Fig. 5.
NMR spectra of folded (with asterisk) and unfolded designed proteins. The folded designs have a wider range of chemical shift values in the amide region of the spectrum (7–10 ppm) and have chemical shift values below 0.5 ppm indicating side-chains strongly shielded from solvent, as would be expected in a well-packed protein core

