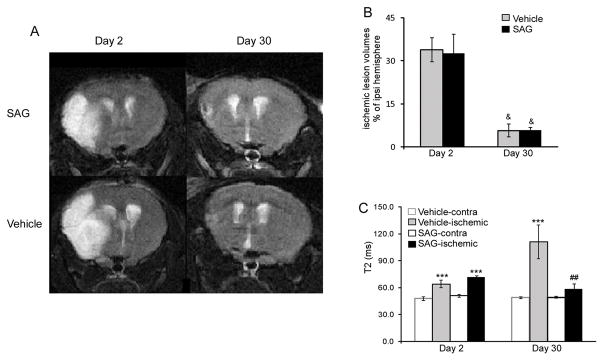
Fig 5.
(A) Representative T2-weighted images of SAG-treated (top) and vehicle-treated (bottom) brains at day 2 (left) and day 30 (right). (B) Percentage ischemic volume at day 2 and day 30. Error bars indicate standard error. &<0.05, day 2 versus day 30. (C)Changes in T2 in ischemic region and contralateral brain region. MEAN± SEM. ***p<0.001, ischemic region versus nonischemic tissue, ##p<0.01, vehicle vs SAG group, n=7.

