
Fig. 3.
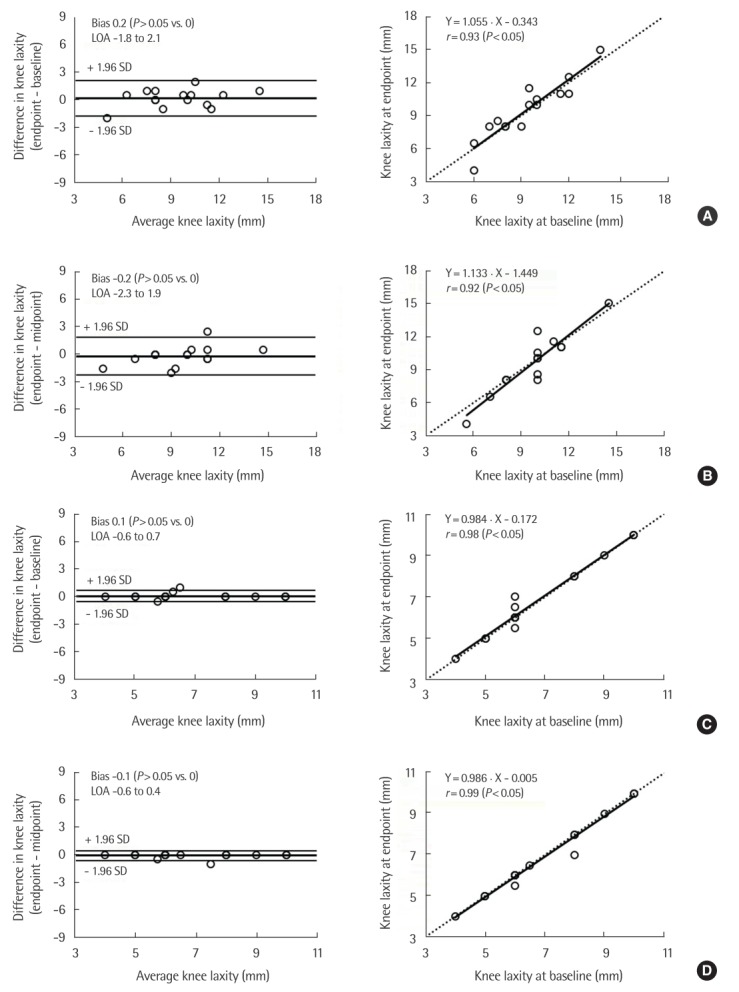
Bland-Altman plots (left) and corresponding intraclass correlations (right) for the anterior knee-displacement (i.e., laxity) scores, using Rolimeter readings, at different time-points after acute knee trauma: (A) injured knee, endpoint vs. baseline, (B) injured knee, midpoint vs. baseline, (C) noninjured knee, endpoint vs. baseline, and (D) noninjured knee, midpoint vs. baseline. Measurements at baseline, midpoint and endpoint were performed 0–7 days, 3–4 weeks, and 6–8 weeks after the trauma, respectively. Bland-Altman plots represent the mean difference in the anterior knee displacement (i.e., systematic bias) ±95% (1.96 standard deviation [SD]) limits of agreement (LOA) between the time-points. Dashed lines in the intraclass correlations represent the lines of identity.