Fig. 1.

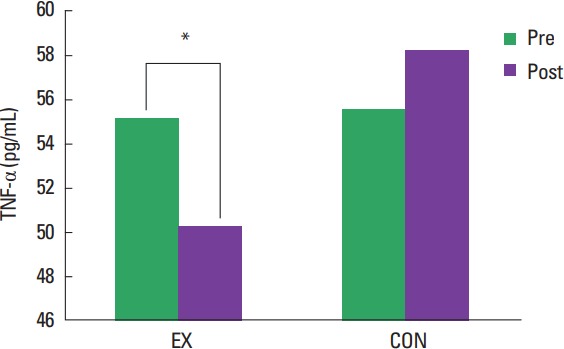
A group by time interaction showing changes in tumor necrosis factor-alpha (TNF-α) Values are presented as mean±standard deviation. EX, exercise group; CON, control group. *P=0.018.

A group by time interaction showing changes in tumor necrosis factor-alpha (TNF-α) Values are presented as mean±standard deviation. EX, exercise group; CON, control group. *P=0.018.