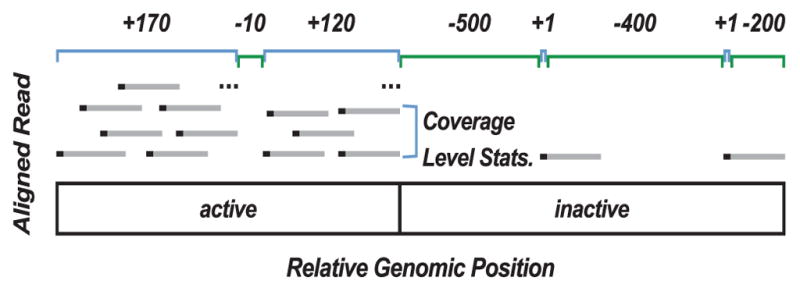
Fig. 1. A schematic showing how contig length and coverage statistics discriminate active from inactive nascent transcription.

Regions of active transcription contain many long contigs (positive length, not drawn to scale) with significant read coverage (labeled in blue) interspersed with short regions of no coverage. Coverage statistics define mean, median, mode and variance of reads (black bars) across a contig, see Table S1. In segments with no reads, a gap (labeled in green) is defined by a negative length value and all coverage statistics are set to zero. For our algorithm, reads (grey bars) are represented by only their 5′ position (black points). Therefore a contig is also a continuous region where every base has at least one read’s 5′ end at that position. Consequently, small gaps between contigs have a high probability of being in an active call.
