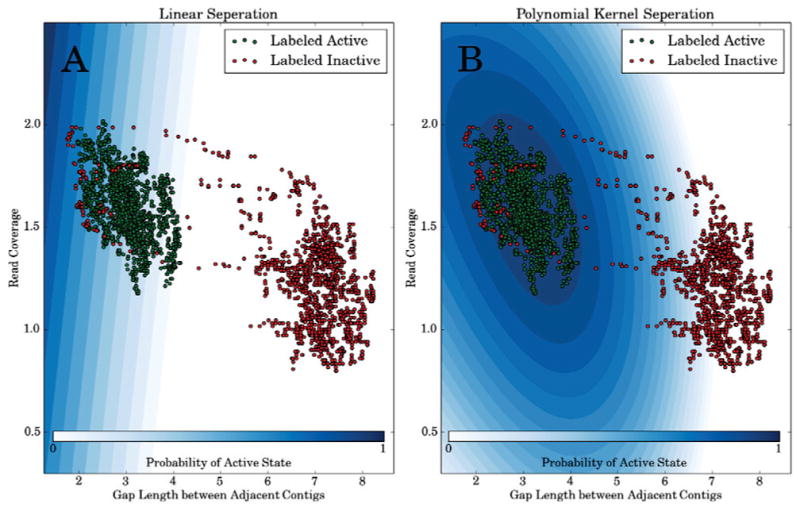
Fig. 2. Read coverage features are not linearly separable.

Points colored green represent training examples labeled active and those colored red indicate training examples labeled inactive. The blue shading provides a contour plot of the active state probability given the feature’s average read coverage (x3, y-axis) and the gap length between adjacent contigs (x1, x-axis in log nucleotides). (A) uses logistic regression with a linear kernel function (i.e. d = 1 in equation 3), whereas (B) uses a second-order polynomial kernel function (i.e. d = 2 in equation 3).
