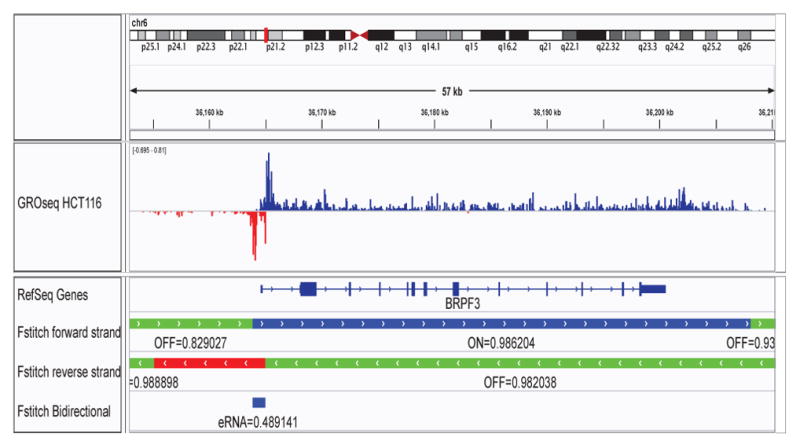
Fig. 3. FStitch output at BRPF3.

An IGV snapshot showing a subregion in chromosome 6 around BRPF3. The first track shows typical GRO-seq data from the HCT116 dataset, with the positive and negative strand in blue and red, respectively. RefSeq annotations are shown next. FStitch output is below for each strand with green indicating areas of inactive transcriptional activity, blue representing areas of active transcription on the positive strand and red on the negative strand. The scores associated with each classification via the Logistic Regression and Viterbi-provided Markov state sequence are also displayed. Finally, bidirectional predictions are provided at the bottom with a score via the estimated Normal Distribution confidence interval.
