
Fig. 4. Examination of the impact of distinct approaches to identify regions of interest.
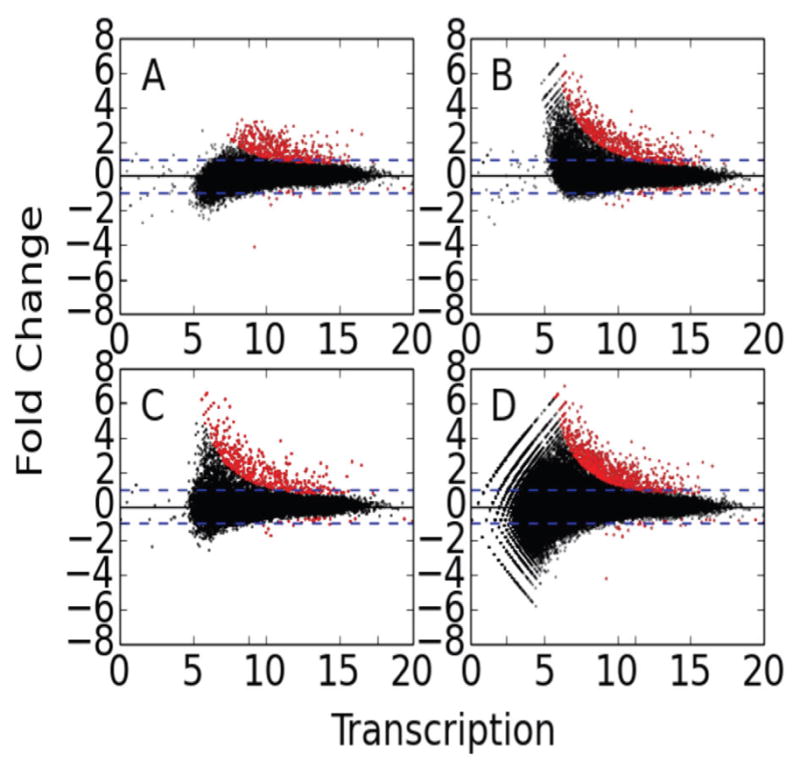
MA-plots were generated by DESeq for each of three distinct methods of determining differential transcription using FStitch active calls. The projection method has two variations, one starts with (A) the DMSO active calls and the other with (B) Nutlin active calls. The other methods are (C) joint and (D) the merge method. See text for details on each method.