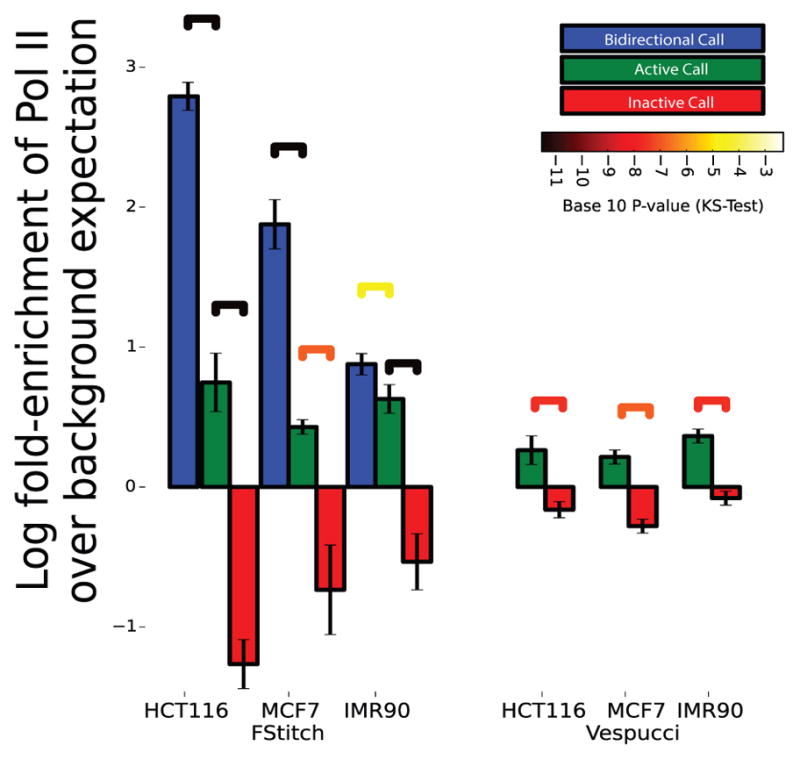
Fig. 6. Correlation of GRO-seq transcript calls with Pol II ChIP-seq.

Pol-II ChIP-seq read density was collected in regions labeled as bidirectional (blue), active (green) or inactive (red) by either FStitch (on left) or Vespucci (on right). Log fold-enrichment is relative to average Pol-II ChIP-seq read density. Statistical significance is assessed via the Kolmogrov-Smirnov test (significance bars colored by p-value). Error bars indicate one standard deviation away from the mean.
