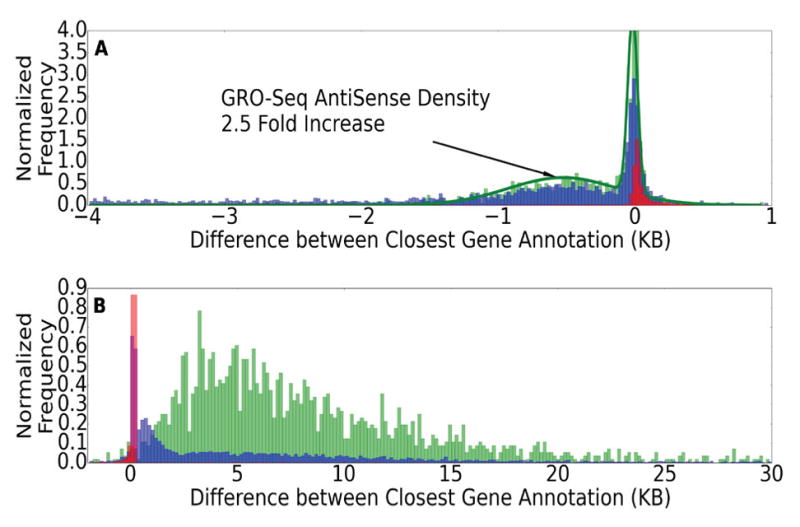
Fig. 9. Histograms comparing the active region calls of FStitch to RefSeq annotations.

We plot the distance between the end of an active call and the nearest RefSeq annotation for (A) 5′-ends; (B) 3′-ends. Colors red, blue and green are Hah et. al., Vespucci (grid search parameters) and FStitch active calls, respectively. Histograms are probability normalized.
