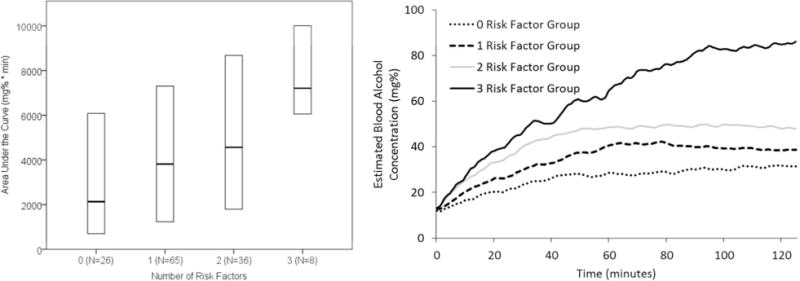
Figure 3. Total Alcohol Exposure by Alcohol Use Disorder Risk Factor Groupa.

a(A) The area under the curve for the estimated breath alcohol concentration by time plot (total alcohol exposure) was examined in each Alcohol Use Disorder risk factor group. Having a higher number of risk factors was significantly associated with total alcohol exposure during the session. The horizontal line in the middle of each box indicates the median, while the bottom and top borders of the box represent the 25th and 75th percentile values, respectively. (B) Lines represent mean blood alcohol concentration for each group.
