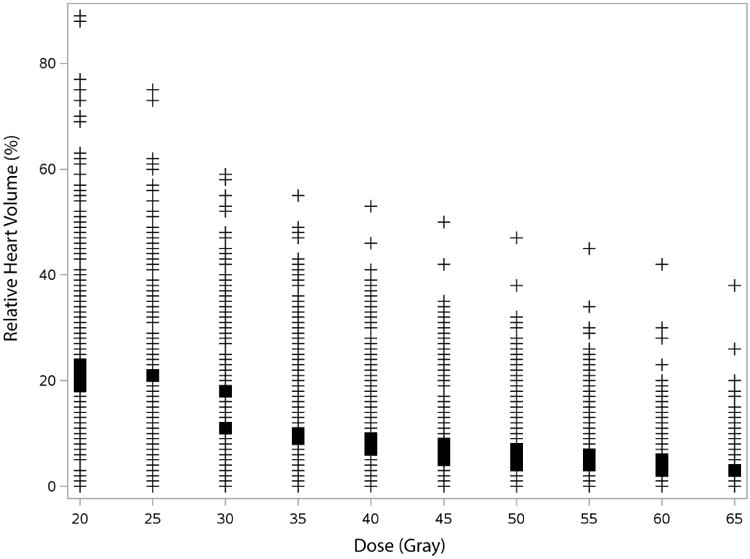
Figure 2.

Cardiac dose-volume variables associated with development of pericardial effusion (PCE). Plotted points (non-weighted) represent actual cardiac volume levels (%V) for each dose threshold (V20-V65) witnessed in the prospective patient population (n=201). Bold marks on columns represent cardiac dose-volume histogram (DVH) variables for which a significant difference (p<.05) was found in freedom from PCE development in patients with V(dose) <%V versus V(dose) ≥%V. Optimal cut-off values for each heart dose (within the bold marks) were identified via recursive partitioning analysis of the null Martingale residuals.
