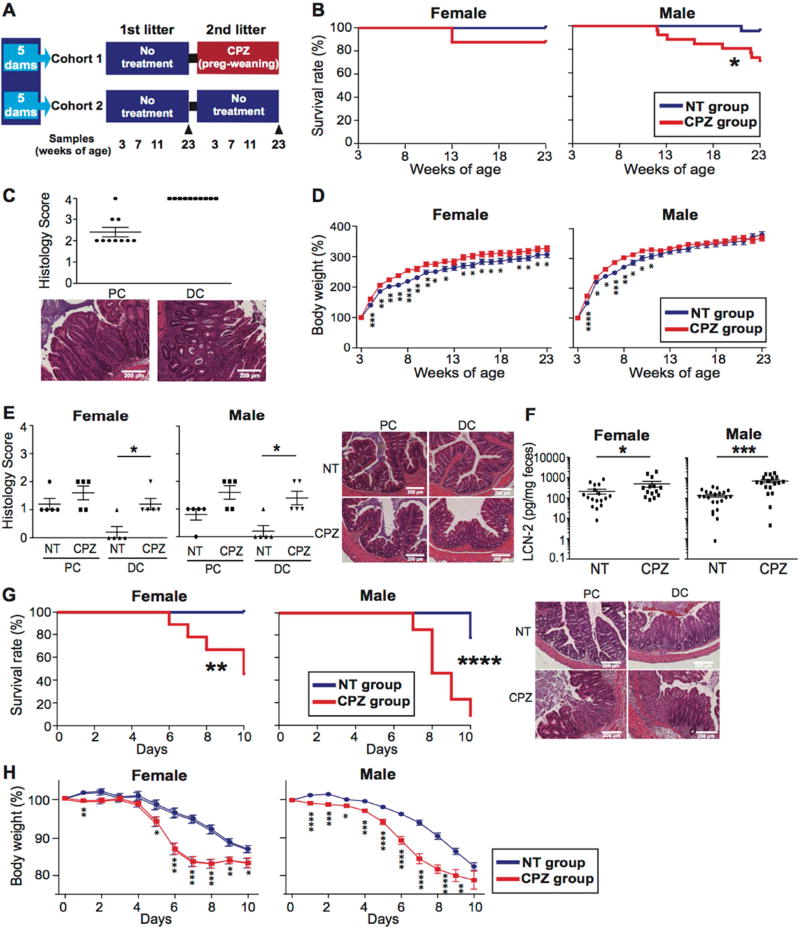
Figure 1. Maternal peripartum exposure to cefoperazone increases the risk for colitis in offspring.
(A) Study design using IL-10 knock-out (KO) mouse model. All mice (cohort 1 and 2) were obtained from 10 breeding pairs subjected to mixed bedding protocol to normalize microbiota among parent cages. Cohort 1 (1st row) included two sequential litters from 5 breeders divided into non-treatment (NT) tracking group (litter 1) and cefoperazone (CPZ) tracking group (litter 2). Cohort 2 (2nd row) included two sequential litters from 5 breeders that were used as additional NT controls to assess/control for generational drift in gut microbiota across litters 1 and 2. (B) Survival rates of NT and CPZ offspring during the observation period (3 to 23 wks of age) (NT group n=17 females; 23 males. CPZ group n=16 females, 26 males). (C) Histology of proximal (PC) and distal colon (DC) for CPZ mice euthanized due to colitis onset (n=2 females, 8 males). Representative H&E histological sections of PC and DC for NT and CPZ. (D) Percent weight change (expressed as % of starting weight) of tracked pups beginning at 3 wks of age (weaning). (E) Histology of PC and DC in mice that did not develop colitis at 23 wks of age (n=5/gender/treatment). (F) Fecal lipocalin-2 (LCN-2) levels were measured in mice that did not develop colitis at 23 wks of age (NT group n=17 females; 22 males. CPZ group n=14 females, 18 males). (G) Survival curves for NT and CPZ mice without frank colitis treated with 2.5% dextran sulfate sodium (DSS) at 23 wks of age. Representative H&E histology of PC and DC are presented for NT and CPZ, respectively following DSS. (H) Weight change following onset of DSS treatment. Mice showing more than 20% body weight loss were euthanized. *p<0.05, **p<0.01, ***p<0.001 and ****p<0.0001. Data are represented as mean ± SEM for (C)-(F) and (H). See also Figure S1.

