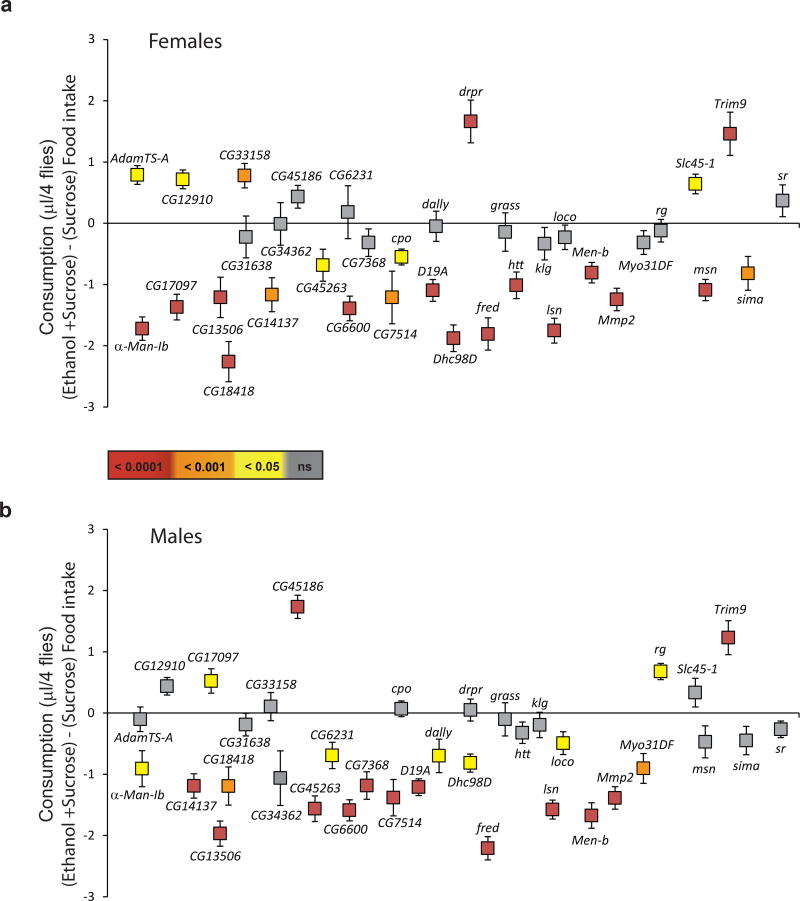
Figure 3. Functional analyses of candidate genes.
Ethanol consumption compared to sucrose consumption alone of 36 candidate female (a) and male (b) mutants. Data are presented as the difference between ethanol and sucrose consumption ± SEM. The color bar indicates the significance levels for both panels a and b. Deviations below zero indicate less ethanol consumption and deviations above zero indicate increased ethanol consumption relative to sucrose consumption.

