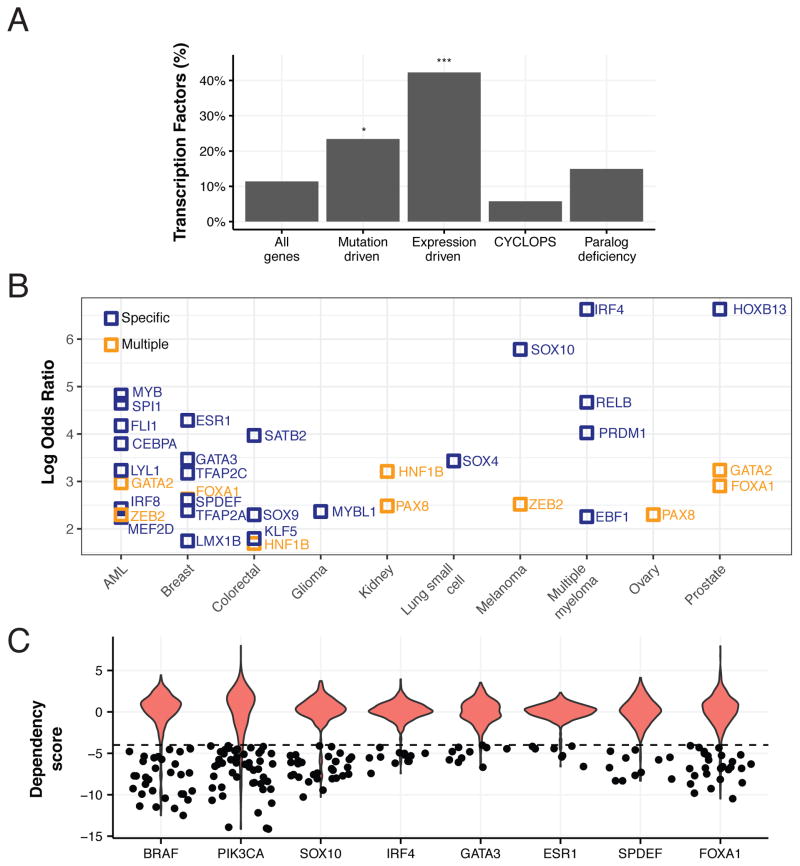
Figure 4. Oncogene and expression addiction MDPs are enriched in lineage-specific transcription factors.
(A) Percentage of transcription factors (TF) among all genes and the four dependency classes. * - P-value < 0.05, *** - P-value < 10−15, Fisher’s exact test. (B) Lineage enrichment (odds ratio; y-axis) of mutation- and expression-driven TF dependencies (N=50) for lineages (x-axis) with significant enrichment (Fisher’s exact FDR < 0.05) in a single (blue) or multiple (orange) lineages. (C) Distributions of 6σ TF dependencies overrepresented in non-essential lineages (ovary, breast, prostate, multiple myeloma and melanoma) compared to known mutation-driven dependencies (BRAF, PIK3CA); dots depict dependency scores greater than 4σ.

