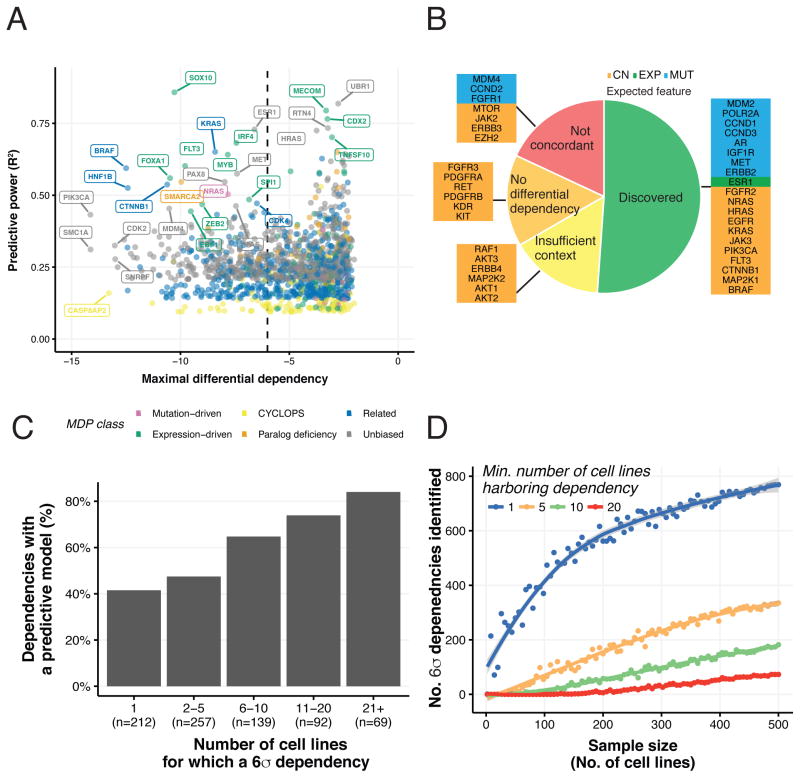
Figure 6. Effects of scale on the completeness of a Cancer Dependency Map.
(A) For each differential dependency with a significant predictive model, the predictive power of the best model (y-axis) and its MDP class (color) along with the strength of the dependency in the most dependent cell line (x-axis). (B) Discovery status of a curated set of 39 mutation- and expression-related dependencies in the dataset. We computed the correlations of each marker with all the differential dependencies and categorized them as (1) Discovered, (2) Not concordant (3) Insufficient context or (4) No differential dependency (see Methods). (C) Fraction of predictable 6σ dependencies, summarized by the number of 6σ dependent cell lines. (D) Results of a down-sampling analysis showing the number of 6σ differential dependencies identified (y-axis) in randomly-sampled subsets of the screened cell lines (x-axis). The blue, orange, green and red lines correspond to dependencies observed in at least 1, 5, 10 or 20 cell lines, respectively.

