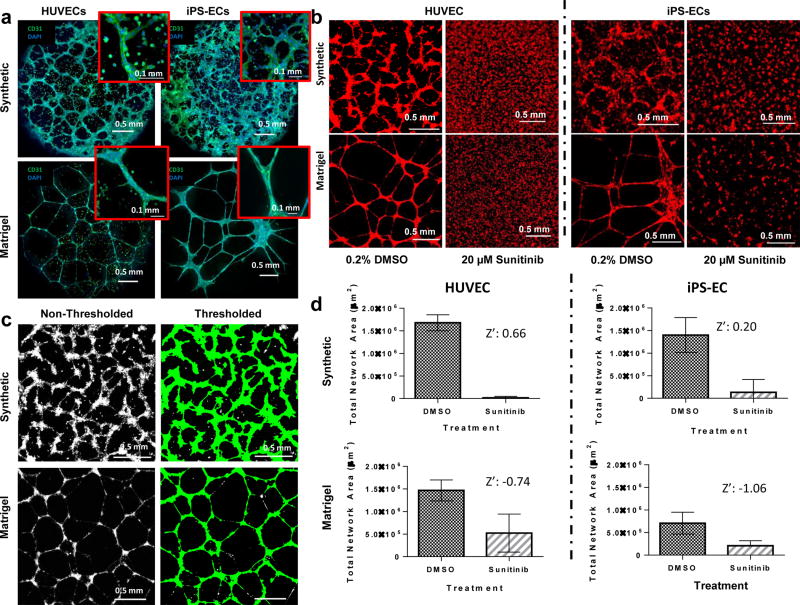
Figure 2.
Visualization and quantification of endothelial networks on synthetic hydrogels and Matrigel. (A) Confocal microscopy images of HUVECs and iPSC-ECs forming networks on synthetic versus Matrigel substrates. Insets: Enhanced magnification of multicellular structures. Scale bar: 0.1 mm (B) HUVECs and iPSC-ECs seeded on synthetic and Matrigel substrates form endothelial networks in DMSO-treated conditions. Network formation is disrupted by Sunitinib treatment. (C) HUVEC networks on synthetic and Matrigel substrates are identified by thresholding fluorescence intensity and object size. Network formation is quantified as total object area per substrate. (D) Endothelial network formation in synthetic hydrogel and Matrigel systems is quantified and subjected to the Z’ test to verify their efficacy of as toxicity screening systems (n = 48). Data represents means and error bars represent standard deviations. The Z’ test was performed twice over the course of these studies. Green: CD31. Red: Cell Tracker Red. Blue: DAPI nuclear stain.

