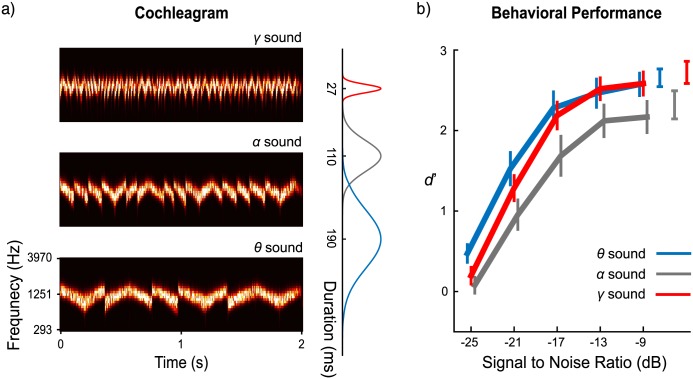
Fig 1. Stimuli and behavioral results.
(a) Cochleograms of 3 stimulus types. A Gammatone filterbank of 64 banks was used to decompose the stimuli. The prior distributions of segment duration for the 3 stimuli are shown on the right. (b) Behavioral performance. The blue, gray, and red lines show d-prime values for θ, α, and γ sounds across different signal-to-noise ratios (SNRs), respectively. The 3 separately plotted results at the top-right corner are d-prime values in clean stimulus conditions. Error bars: ±1 standard error of the mean. Data are deposited in the Dryad repository: http://dx.doi.org/10.5061/dryad.f357r [121].

