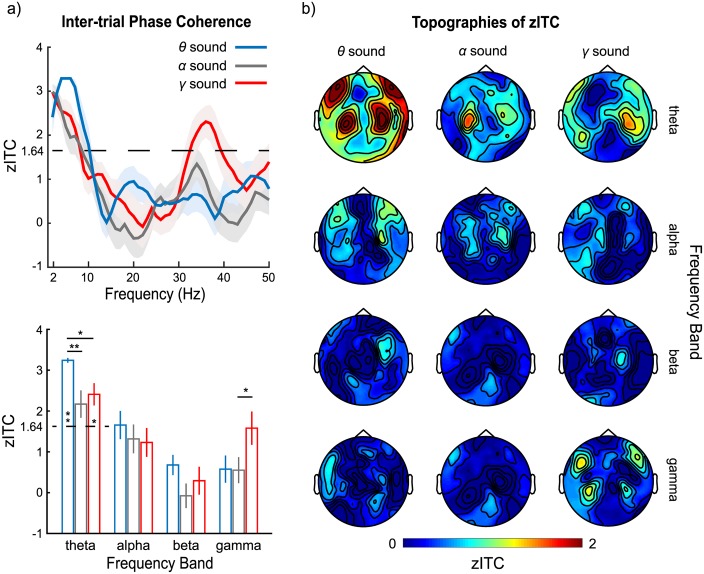
Fig 2. Z-scores of intertrial phase coherence (zITC) to 3 clean stimuli and their response topographies.
(a) Top panel, spectra of zITC for θ, α, and γ sounds. The dashed line (z-score of 1.64) is equivalent to an alpha level of 0.05 (1-tailed, corrected). The shaded areas represent ±1 standard error of the mean. The bottom panel shows zITC for θ, α, and γ sounds in 4 frequency bands, theta (4–7 Hz), alpha (8–12 Hz), beta (13–30 Hz), and gamma (31–45 Hz). The color scheme of blue, gray, and red in both panels represents zITC of θ, α, and γ sounds, respectively. The error bars represent ±1 standard error of the mean. (b) Topographies of zITC for each sound at each frequency band. Auditory response patterns (compared to, for example, classic evoked M100 responses) are observed clearly in the theta band for θ sounds as well as for the α and γ sounds. In the gamma band, the topographies show the auditory response pattern only for the γ sound. No clear pattern is observed in other frequency bands. Data are deposited in the Dryad repository: http://dx.doi.org/10.5061/dryad.f357r [121].

