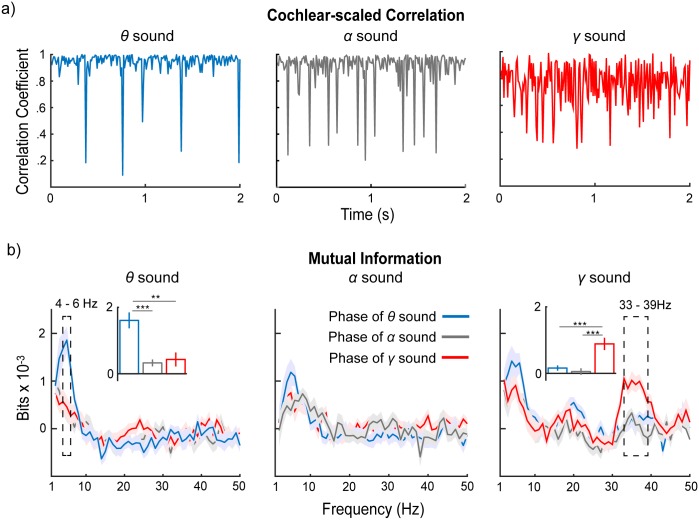
Fig 4. Mutual information between cochlear-scaled correlation and phase of neural oscillations.
(a) Cochlear-scaled correlation of θ, α, and γ sounds. (b) Mutual information results. The colors represent mutual information computed using the phase of the neural oscillation to different sounds: blue, θ sound; gray, α sound; red, γ sound. The inset bar graphs show the averaged mutual information within frequency ranges that show significant main effects of the stimulus type. The robust phase coherence observed in the theta band for θ sound and in the gamma band for γ sound is caused by tracking acoustic structures instead of simply being evoked by general acoustic stimuli. The shaded areas represent ±1 standard error of the mean. Data are deposited in the Dryad repository: http://dx.doi.org/10.5061/dryad.f357r [121].

