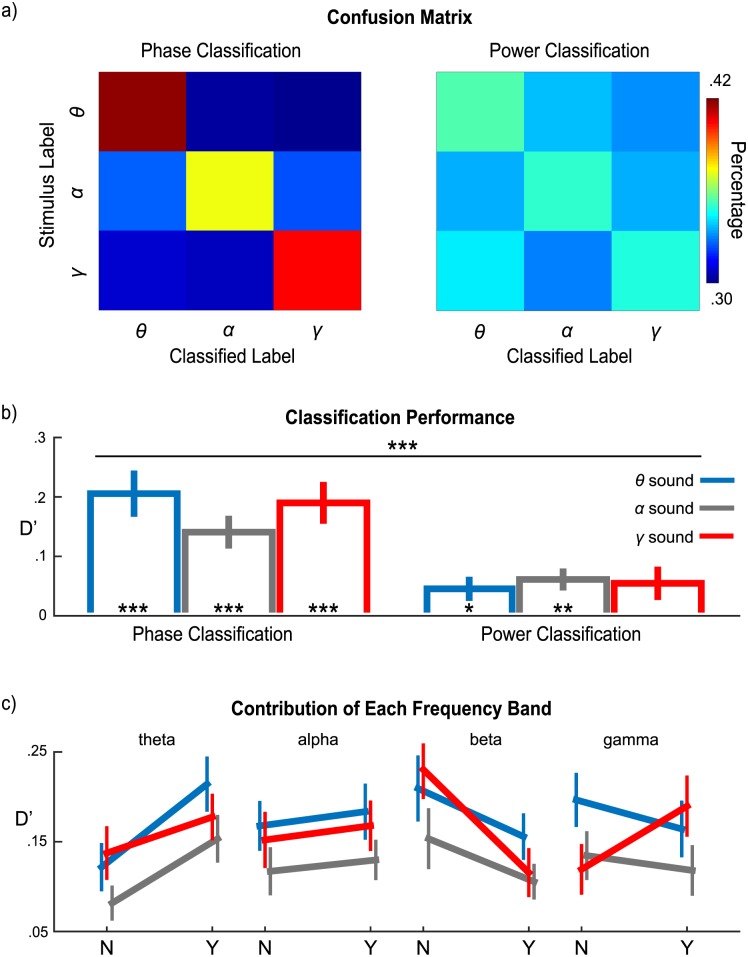
Fig 5. Classification results.
(a) Confusion matrices for phase-based and power-based classifications. “Stimulus label” represents the actual stimulus type and “classified label” represents the classified bin. Color bar codes the percentage of trials classified into each bin. (b) Classification performance for each sound using phase and power. Phase-based classification performs significantly better than power-based classification. The blue, gray, and red bars represent θ, α, and γ sounds, respectively. (c) Frequency band contributions to phase-based classification of each sound. “N” indicates classification without the given frequency band; “Y” indicates classification with the given frequency band. Phase in the theta band improves performance for classifying all stimuli and phase in the gamma band contributes to classifying γ sound. The color scheme is as in (b). The error bars represent ±1 standard error of the mean. Data are deposited in the Dryad repository: http://dx.doi.org/10.5061/dryad.f357r [121].

