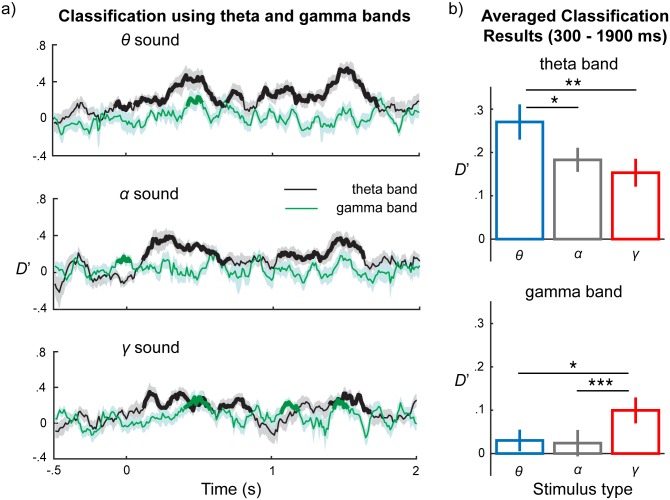
Fig 6. Temporal progression of classification performance in the theta and the gamma bands.
(a) Classification performance along each time point. Upper panel: classification results using phase series of the theta and the gamma bands for θ sounds, from 500 ms before the onset of stimuli to 2,000 ms after the onset of stimuli; middle panel shows results for α sounds; lower panel shows results for γ sounds. Classification results using the theta band in black and the gamma band in green. Lines represent the mean classification results averaged across subjects. The bolded parts represent clusters significantly larger than baseline, D′ = 0. Significant clusters are observed in the theta band after the onset of stimuli for all 3 sounds. In the gamma band, the significant clusters are found mainly for γ sounds. (b) Classification results averaged from 300 to 1,900 ms after the onset of stimuli for each band. The upper panel represents the classification results using the theta band for θ, α, and γ sound and the low panel the classification results using the gamma band. Classification performance for θ sounds using the theta band is significantly larger than that for α and γ sounds, whereas classification performance for γ sound using the gamma band is larger than that for θ and α sounds. The error bars and shaded areas represent ±1 standard error of the mean. Data are deposited in the Dryad repository: http://dx.doi.org/10.5061/dryad.f357r [121].

