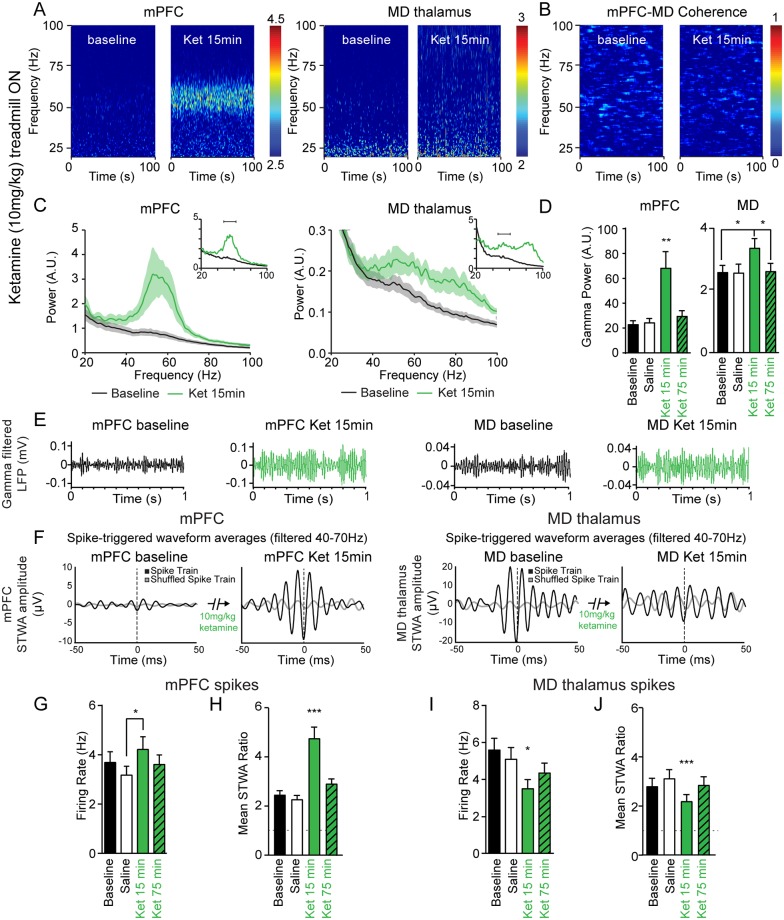
Fig 2. Ketamine-induced increases in gamma LFP power and spiking activity during treadmill walking.
A, Representative wavelet-based scalograms show the time-frequency plots of LFP spectral power before ketamine (baseline) and 13–17 minutes after 10 mg/kg ketamine s.c. (Ket 15 min). B, Representative FFT-based spectrogram shows time-frequency coherence between the mPFC and MD thalamus before ketamine and after ketamine. C, Averaged LFP power spectra for epochs before ketamine (black), and after ketamine (green). Insets show representative traces for each structure. D, Bar graph shows mean total gamma LFP power (peak ± 7 Hz) from the mPFC (n = 10 rats) and the MD thalamus (n = 6 rats) during treadmill walking at baseline (black), 15 minutes after saline injection (white), and 15 minutes (green) or 75 minutes (green with diagonal stripes) after 10 mg/kg ketamine injection. E, Representative examples of gamma band-pass filtered LFP (40–70 Hz) in the mPFC and MD thalamus. F, Representative STWAs of a mPFC pyramidal neuron (D) and MD thalamus neuron (E) with LFPs filtered from 40–70 Hz 15 minutes before and after ketamine administration. G, I, Mean firing rates of pyramidal neurons in the mPFC (G, n = 45 neurons from 6 rats) and the MD thalamus (I, n = 37 neurons from 6 rats). H, J, Bar graphs show spike-gamma LFP correlations (filtered from 40–70 Hz) for putative mPFC pyramidal neurons (H) and MD thalamus neurons (J). Values are reported as mean ± SEM. Stars over a single bar indicate this value differs significantly from the three other conditions. *: p < 0.05, **: p < 0.01, ***: p < 0.001, paired bootstrap tests with Bonferroni correction.

