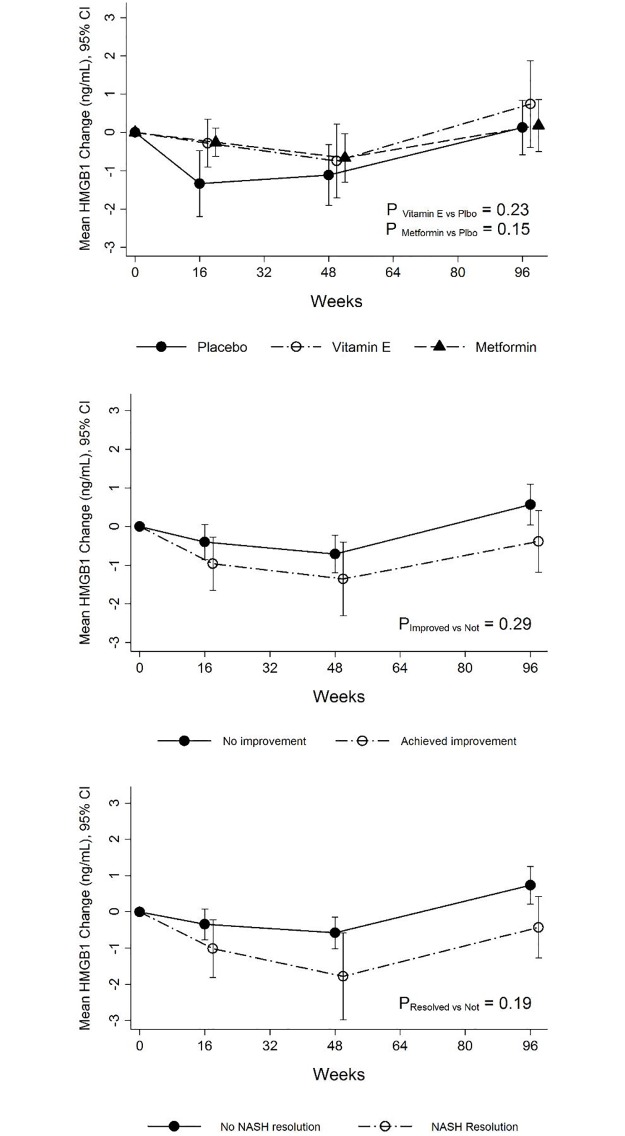
Fig 2. Serum HMGB1 levels during the TONIC trial in the three treatment groups.
At baseline, serum HMGB1 levels among the three treatment groups were similar. Top panel: serum HMGB1 levels did not change significantly during treatment either with placebo, metformin (P = 0.15) or vitamin E (P = 0.23) therapy. Middle panel: Serum HMGB1 levels did not differ among individuals with or without treatment response (per protocol) during study duration (P = 0.29), irrespective of treatment assignment. Bottom panel: Similarly, serum HMGB1 levels did not differ among individuals during study duration with or without resolution of NASH (P = 0.19) irrespective of treatment assignment.

