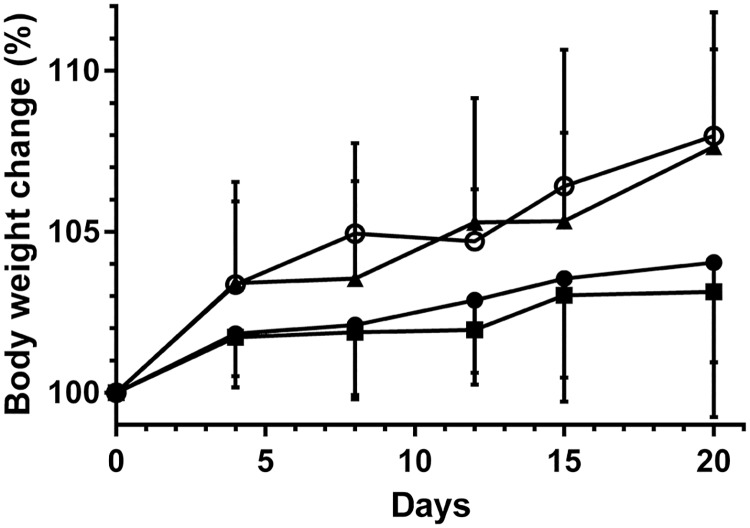
Fig 3. L1p-FH applied to mSMG increased body weight.
Changes in body weight (%) of FH alone (■) or L1p-FH (▲) treated mice groups were compared with untreated mice group (●) and sham control group (○) over 20-day period. Data represent the means ± SD of n = 7 mice per condition and statistical significance was assessed by two-way ANOVA (p < 0.01) and Dunnett's post-hoc test for multiple comparisons to the untreated group.

