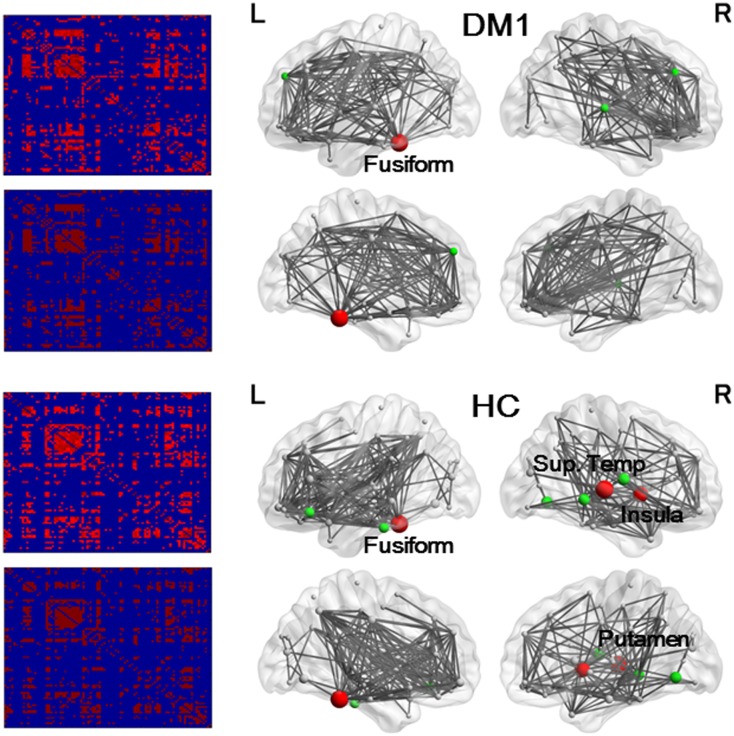
Fig 2. Results of association matrices (left) and network hub nodes and edges (right).
Lines indicate the edge, and spheres represent nodes. The size of the nodes is proportional to the betweenness centrality (BC). Red denotes hub nodes with BC > 2 standard deviation (SD), and green denotes BC > 1 SD. In DM 1 patients, hub nodes with BC > 2 SD were found only in the left fusiform gyrus, and hub nodes with BC > 1 SD were found in the superior and middle frontal gyrus, and superior temporal gyrus. In controls, hub nodes with BC > 2 SD were found in the right insula, putamen, superior temporal gyrus, and left fusiform gyrus, and hub nodes with BC > 1 SD were found in the middle and inferior gyrus, orbitofrontal gyrus, lingual gyrus, and rolandic operculum.

