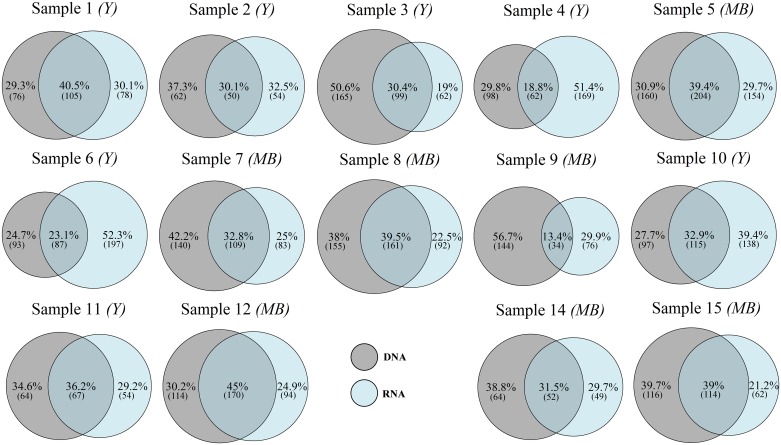
Fig 3. Venn diagrams showing the percentage of DNA-only, shared eDNA/eRNA, and RNA-only Operational Taxonomic Units (OTUs) in individual pairs of eDNA and eRNA samples.
Numbers in brackets correspond to the number of OTUs in each group. Samples from either yachts (Y) or motorboats (MB) are indicated.

