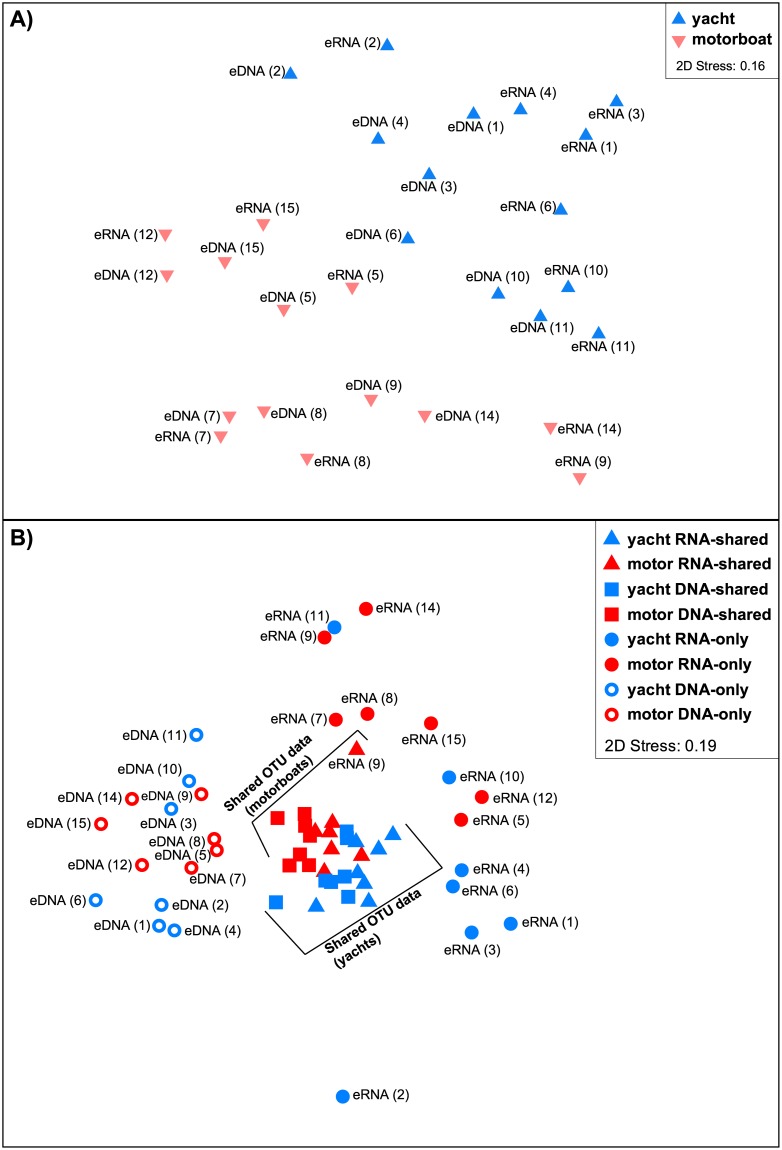
Fig 4. Non-metric multi-dimensional scaling (nMDS) plot analyses.
Plots are constructed using Jaccard similarity matrices from; (A) presence-absence of Operational Taxonomic Units (OTU)-based diversity between the global eDNA and eRNA datasets collected on yachts versus motorboats, and (B) taxonomic composition (presence-absence) based on OTU data aggregated at Phylum-level, split into eDNA-only, eDNA/eRNA-shared, and eRNA-only for samples from yachts and motorboats. Sample numbers are indicated in parentheses (refer to Table 1).

