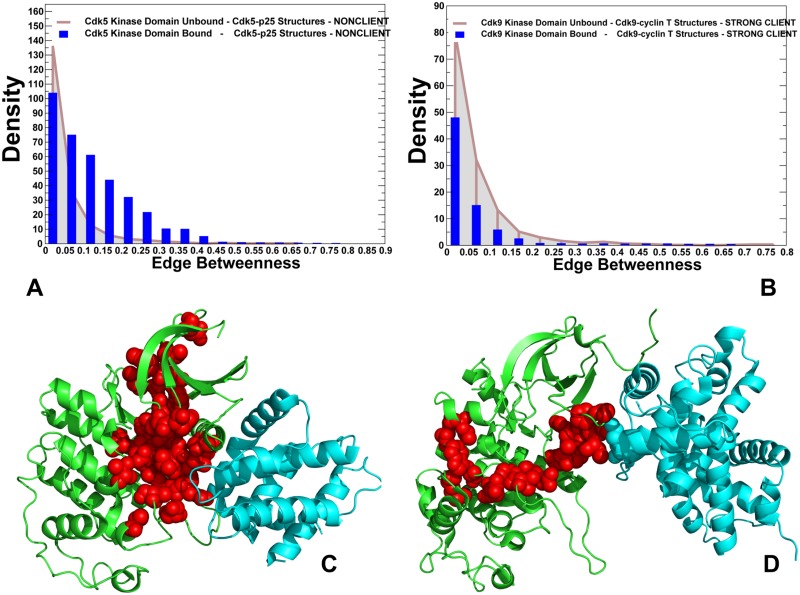
Fig 8. Network analysis of the ensembles of short paths and allosteric communications in the CDK structures.
The edge centrality distributions for the unbound and bound forms of CDK5 structures (A) and CDK9 structures (B). The density of states distributions for the unbound kinase forms are shown in grey bars and for the bound kinase forms in blue bars. Structural mapping of high centrality edges in the CDK5-p25 complex (pdb id 3O0G) (panel C) and in the CDK9-cyclin T complex (pdb id 4EC8) (panel D). The kinase domains are shown in green ribbons and binding partners are shown in cyan ribbons. The residues forming high centrality edges are shown in red spheres. For clarity, high centrality connectors are presented only for the kinase domains.

