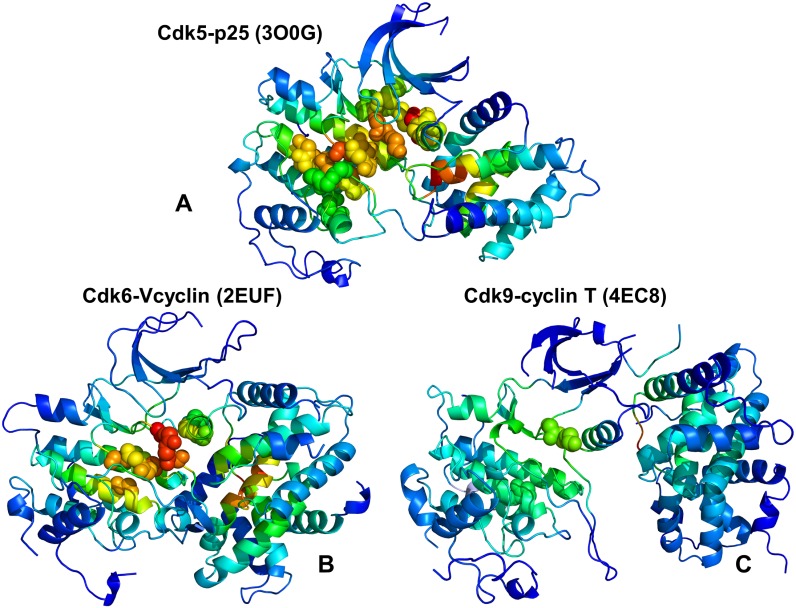
Fig 10. Structural maps of the effector propensities in the CDK structures.
Structural mapping of the effector propensities is shown for the CDK5-p25 complex (pdb id 3O0G) (panel A), CDK6-Vcyclin complex (pdb id 2EUF) (panel B), and CDK9-cyclin T complex (pdb id 4EC8) (panel C). The structural maps are color-coded from low preferences to act as effectors (in blue) to high propensities to act as effectors (in red). The maps are shown for complete complexes and include contribution of the kinase domain and binding partner. The most influential effector sites in PRS profiles corresponding to the dominant peaks in the PRS effector profiles are shown in spheres that are colored according to the effector propensities. Structural maps highlight the greater number and the higher density of effector peaks (mediating clusters) in CDK5 (A), the decreasing density of effector clusters in CDK6 (B), and a small number of isolated effector centers in CDK9.

