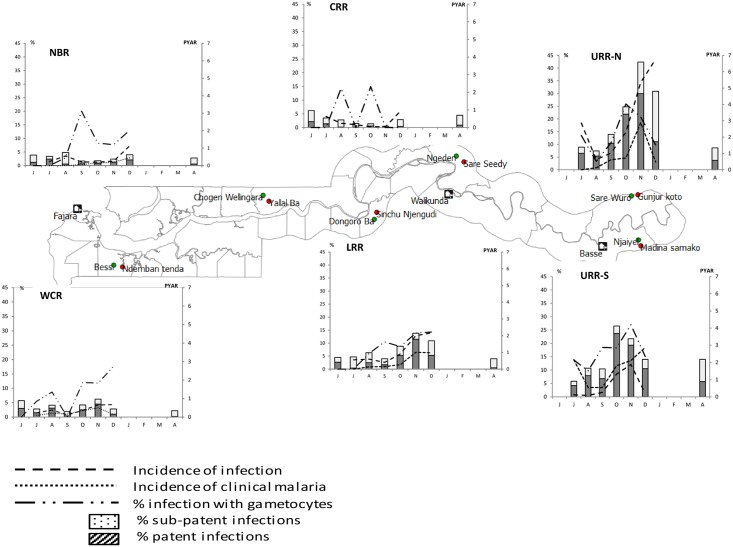
Fig 3. Prevalence and incidence of malaria infection and clinical malaria by month and region.
The incidence rates were significantly higher in three regions compared to the WCR; URR-N (P. falciparum infection = 2.82/PYAR, 95% CI: 2.57–3.10; and clinical malaria = 1.0/PYAR, 95%CI: 0.82–1.11, p<0.01) and URR-S (P. falciparum infection = 1.42/PYAR, 95% CI: 1.31–1.54; and clinical malaria = 0.8/PYAR, 95%CI: 0.68–0.85; p<0.01) had the highest incidence, followed by LRR (P. falciparum infection = 0.98/PYAR, 95% CI:0.86–1.12; clinical malaria = 0.36/PYAR, 95%CI: 0.29–0.455; p<0.01). The incidence of P. falciparum infections in the WCR (0.47/PYAR, 95% CI: 0.40–0.56) was 2 times higher than in the CRR (0.29/PYAR, 95%CI: 0.22–0.37) (p<0.01) where not a single clinical malaria case was detected (Table 6 and Fig 3).

