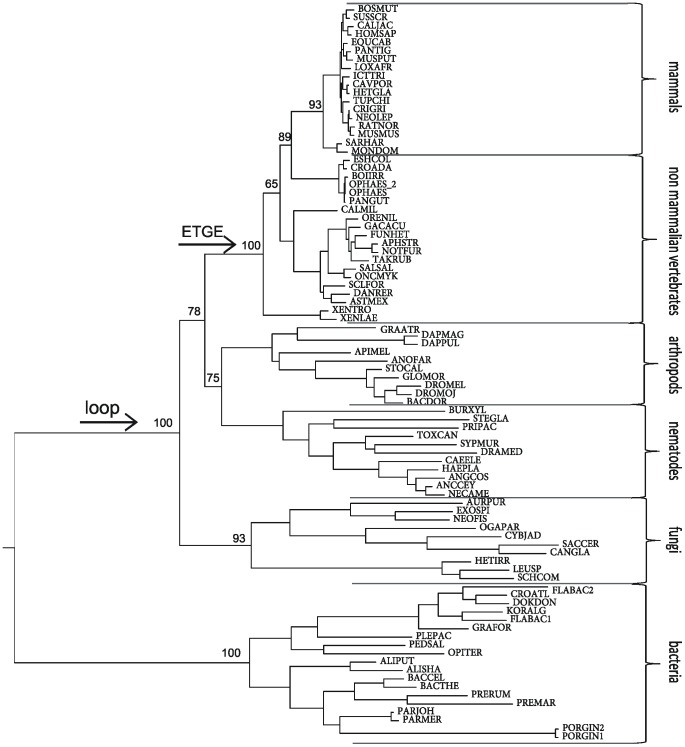
Fig 4. Phylogenetic tree of the M49 family.
The tree is based on a multiple sequence alignment and maximum likelihood analysis of 87 peptidases of the M49 family. The branch support values are indicated at the major branch points. Species abbreviations are given in S2 Table. Arrows represent the appearance of the loop between the two conserved active-site motifs in the upper domain and the emergence of the ETGE motif.

