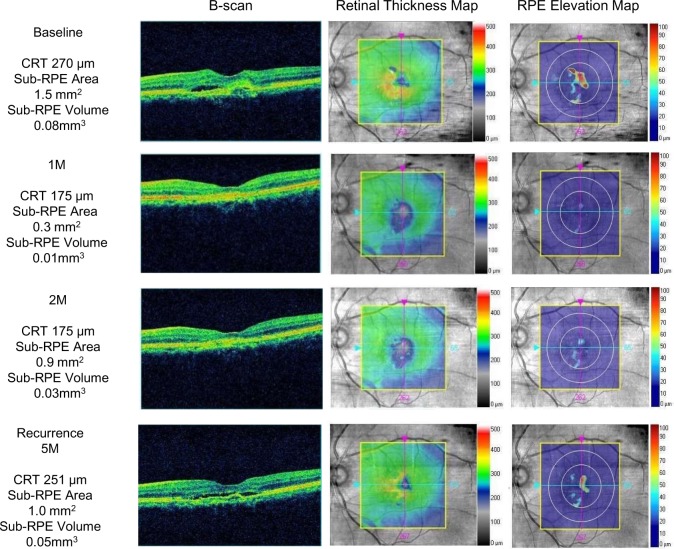
Fig 1. Spectral-domain optical coherence tomography imaging obtained from an 82-year-old man with type 1 choroidal neovascularization.
(Top row) At baseline, the B-scan shows a sub-RPE space with subretinal fluid and subretinal hyperreflective material. The RT map shows the presence of fluid (orange); the central retinal thickness (CRT) is 270 microns. The RPE elevation map shows the sub-RPE space (red); the sub-RPE area and volume are 1.5 mm2 and 0.08 mm3, respectively. (Second row) One month after the loading phase, the subretinal fluid has disappeared from the B-scan and RT map, and the CRT has decreased to 175 microns. The RPE elevation map shows the decreased sub-RPE space; the area and volume are 0.3 mm2 and 0.01 mm3, respectively. (Third row) Two months after the loading phase, the B-scan and RT map are stable compared to the previous month; the CRT is unchanged at 175 microns. In contrast, the RPE elevation map shows a considerably larger pigment epithelial detachment (PED) compared with the previous month; the area and volume are 0.9 mm2 and 0.03 mm3, respectively. (Bottom row) At the time of recurrence at 5 months after the loading phase, the B-scan shows that a sub-RPE space developed with subretinal fluid. The RT map shows the presence of fluid again (yellow), and the CRT has increased to 251 microns. The RPE elevation map shows an increase in the area of the sub-RPE; the area and volume are 1.0 mm2 and 0.05 mm3, respectively.

