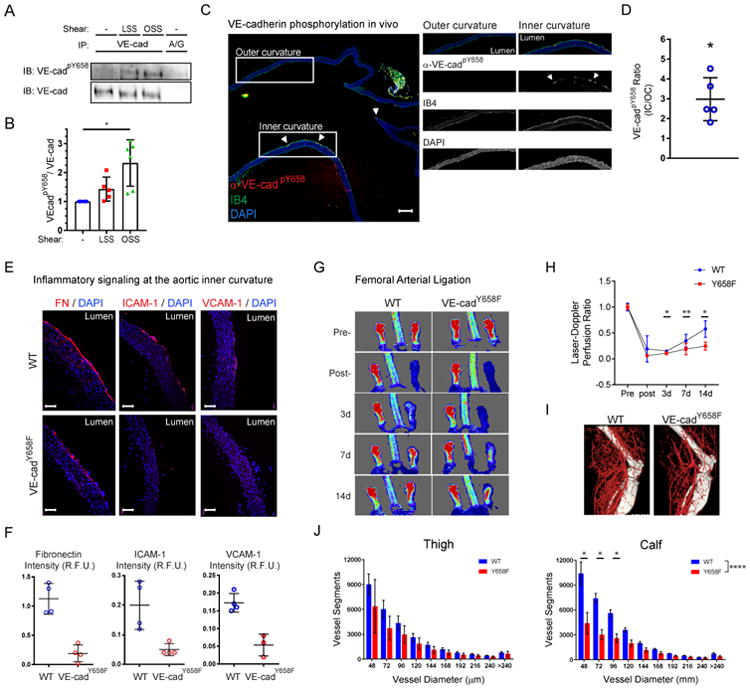
Figure 2. VE-cadherin Y658 phosphorylation functions in vivo.

(A) Endothelial cells in vitro were exposed to no flow, laminar flow at 15 dynes/cm2 (LSS) or oscillatory flow at 1±3 dynes/cm2 (OSS) for 16h. VE-cadherin Y658 phosphorylation was then assayed by Western blotting as in STAR Methods. (B) quantification of (A). (C) Aortas from adult WT mice were sectioned longitudinally and stained with anti-VEcadpY658 and fluorescent Isolectin B4 (IB4) to label the endothelium. Scale bar = 200μm. (D) Quantification of (C). The ratio of endothelial inner curvature/outer curvature signal for each image was quantified (n=5 aortas). * p ≤ 0.05. (E) Aortas from 6-8wk WT or VE-cadherinY658F knock in mice were sectioned and immunostained as indicated. (F) Fluorescent signals from Inner curvature regions were quantified in 3-4 different aortas for each antibody. Scale bar = 100μm. * p ≤ 0.05. (G) WT or Y658F mice were subject to femoral artery ligation and blood flow in the hindlimb assayed by Doppler imaging on subsequent days. (H) Quantification of laser Doppler imaging results. * p ≤ 0.05, ** p ≤ 0.01. (I) MicroCT of vasculature in treated leg of WT and Y658F mice. (J) Quantification of vascular microCT from 4-5 mice. * p ≤ 0.001, **** p ≤ 0.0001 by ANOVA.
